简介
对于绝大部分服务,跟踪刨析是用不到的。但是如果遇到了下面问题,可以不妨一试:
- 怀疑哪个协程慢了
- 系统调用有问题
- 协程调度问题 (chan 交互、互斥锁、信号量等)
- 怀疑是 gc (Garbage-Collect) 影响了服务性能
- 网络阻塞
- 等等
坦白的讲,通过跟踪刨析可以看到每个协程在某一时刻在干什么。
做跟踪刨析,首先需要获取trace 数据。可以通过代码中插入trace, 或者上节提到的通过pprof 下载即可。
Example
Code
下面通过代码直接插入的方式来获取trace. 内容会涉及到网络请求,涉及协程异步执行等。
package main

import (
	"io/ioutil"
	"math/rand"
	"net/http"
	"os"
	"runtime/trace"
	"strconv"
	"sync"
	"time"
)


var wg sync.WaitGroup
var httpClient = &http.Client{Timeout: 30 * time.Second}

func SleepSomeTime() time.Duration{
	return time.Microsecond * time.Duration(rand.Int()%1000)
}

func create(readChan chan int) {
	defer wg.Done()
	for i := 0; i < 500; i++ {
		readChan <- getBodySize()
		SleepSomeTime()
	}
	close(readChan)
}

func convert(readChan chan int, output chan string) {
	defer wg.Done()
	for readChan := range readChan {
		output <- strconv.Itoa(readChan)
		SleepSomeTime()
	}
	close(output)
}

func outputStr(output chan string) {
	defer wg.Done()
	for _ = range output {
		// do nothing
		SleepSomeTime()
	}
}

// 获取taobao 页面大小
func getBodySize() int {
	resp, _ := httpClient.Get("https://taobao.com")
	res, _ := ioutil.ReadAll(resp.Body)
	_ = resp.Body.Close()
	return len(res)
}

func run() {
	readChan, output := make(chan int), make(chan string)
	wg.Add(3)
	go create(readChan)
	go convert(readChan, output)
	go outputStr(output)
}

func main() {
	f, _ := os.Create("trace.out")
	defer f.Close()
	_ = trace.Start(f)
	defer trace.Stop()
	run()
	wg.Wait()
}
编译,并执行,然后启动trace;
[~/blog]$ go build trace_example.go
[~/blog]$ ./trace_example
[~/blog]$ go tool trace -http=":8000" trace_example trace.out
2020/04/15 17:34:48 Parsing trace...
2020/04/15 17:34:50 Splitting trace...
2020/04/15 17:34:51 Opening browser. Trace viewer is listening on http://0.0.0.0:8000
然后打开浏览器,访问8000 端口即可。
Trace 功能

其中:
View trace:查看跟踪 (按照时间分段,上面我的例子时间比较短,所以没有分段)
Goroutine analysis:Goroutine 分析
Network blocking profile:网络阻塞概况
Synchronization blocking profile:同步阻塞概况
Syscall blocking profile:系统调用阻塞概况
Scheduler latency profile:调度延迟概况
User defined tasks:用户自定义任务
User defined regions:用户自定义区域
Minimum mutator utilization:最低 Mutator 利用率 (主要是GC 的评价标准, 暂时没搞懂)
goroutine 调度分析
下图包含了两种事件:
- 网络相关 main.create 触发网络写的协程,网络写操作的协程 writeLoop,然后等待网络返回。
- GC 相关操作
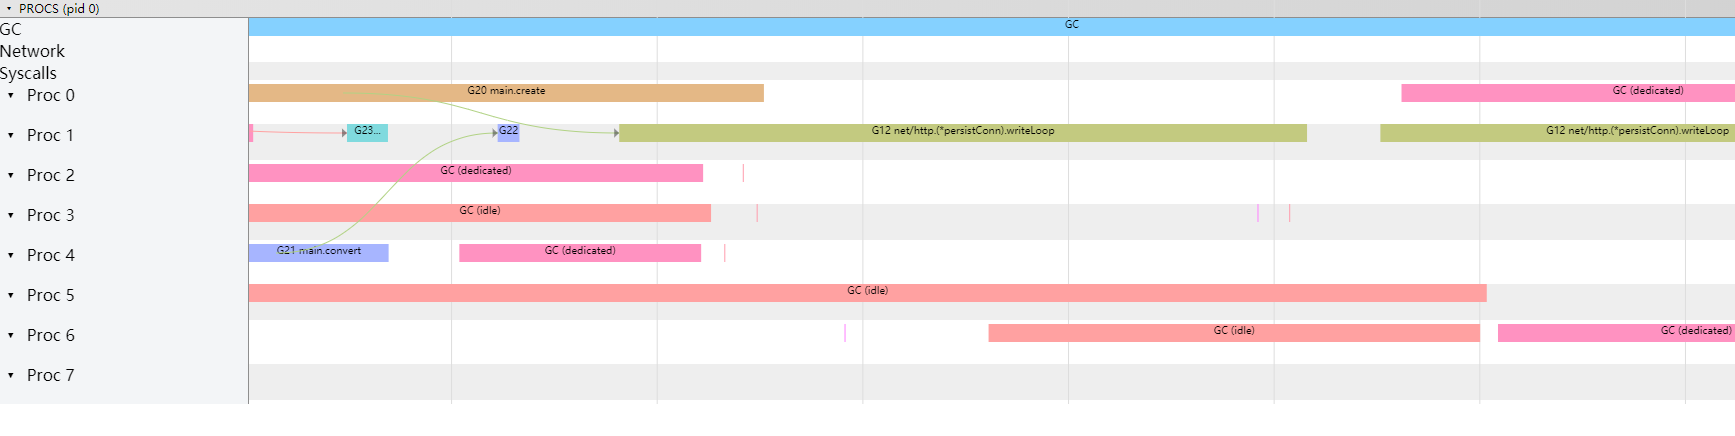
下面是web请求到数据,从epoll 中触发,然后readLoop协程响应,直接触发main.create 的协程得到执行。

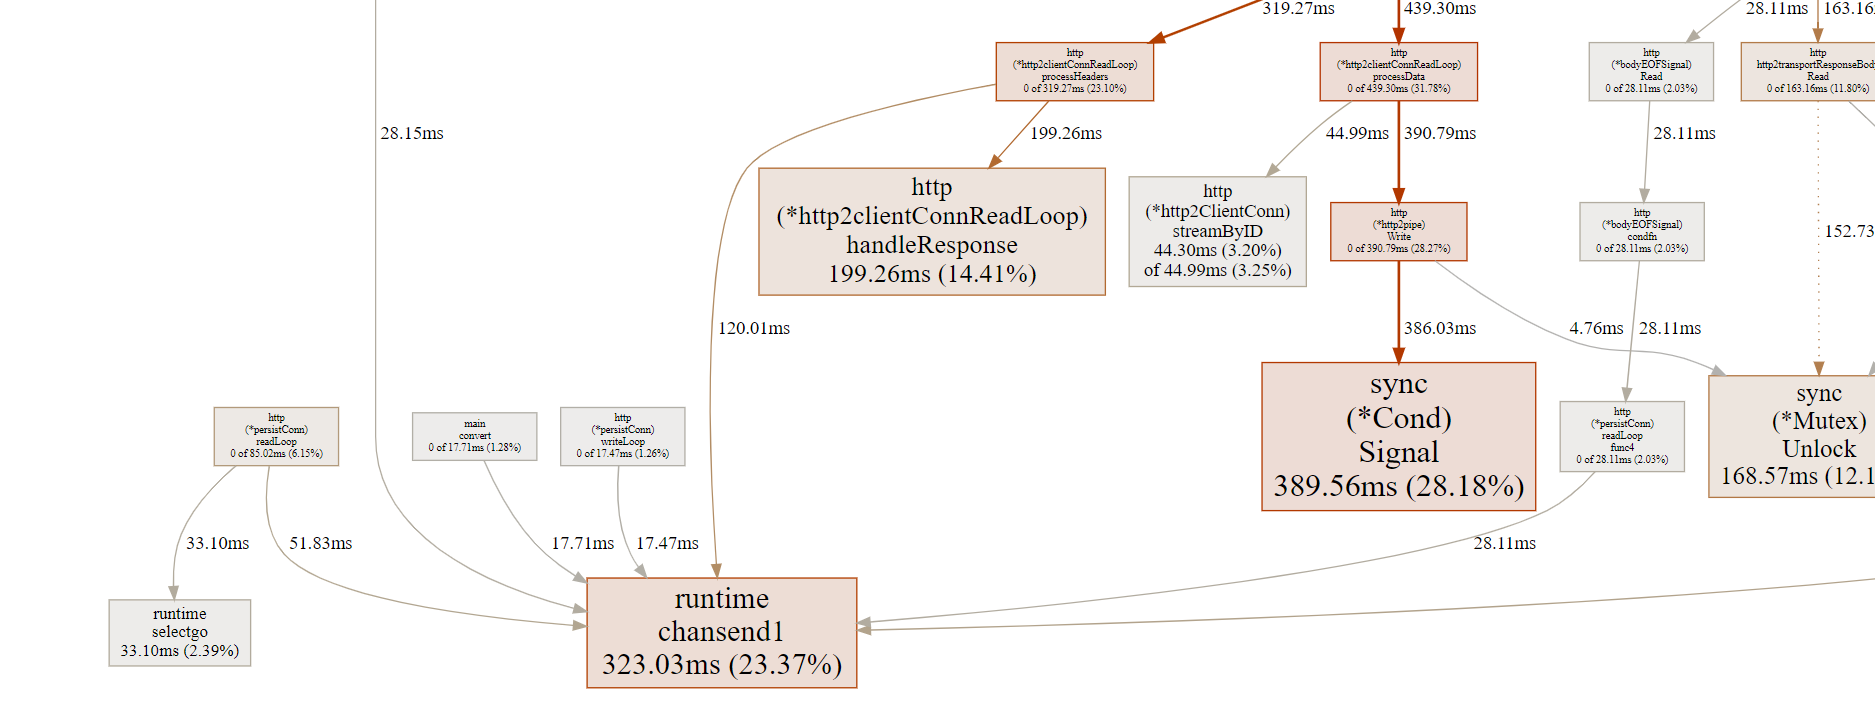
当然我们也可以筛选协程做具体分析,从 Goroutine analysis 进入,选择具体的协程进行分析:

我们选择对 main.create 的协程做分析(这个协程略复杂,可以分析的东西比较多)

可以从图中看出,network 唤醒 readLoop 协程,进而readLoop 又通知了main.create 协程。

当然,我们也可以选择 main.convert 协程。可以看出协程被main.create 唤醒了(由于给chan 提供了数据)

除了可以分析goroutine 调度之外,还可以做网络阻塞分析,异步阻塞分析,系统调度阻塞分析,协程调度阻塞分析(下图)
自定义 Task 和 Region
当然,还可以指定task 和 Region 做分析,下面是官方举的例子:
//filepath:  src/runtime/trace/trace.go
ctx, task := trace.NewTask(ctx, "makeCappuccino")
trace.Log(ctx, "orderID", orderID)

milk := make(chan bool)
espresso := make(chan bool)

go func() {
        trace.WithRegion(ctx, "steamMilk", steamMilk)
        milk <- true
}()
go func() {
        trace.WithRegion(ctx, "extractCoffee", extractCoffee)
        espresso <- true
}()
go func() {
        defer task.End() // When assemble is done, the order is complete.
        <-espresso
        <-milk
        trace.WithRegion(ctx, "mixMilkCoffee", mixMilkCoffee)
}()
MMU 图
除此之外,还提供了Minimum Mutator Utilization 图 (mmu 图 )
mmu 图,数轴是服务可以占用cpu的百分比 (其他时间为gc操作)

从图中可以看出,在2ms之后,可利用的cpu逐步上升,直到接近100%.所以gc 毫无压力。
重点提醒
- 必须用chrome,并且高版本不行。我使用的是76.
- trace 的文件都比较大,几分钟可能上百兆,所以网络一定要好,或者使用本机做验证。
- 造作是 w 放大, s 缩小, a 左移, d 右移
- gc 的mmu 图解释 (备注下,还没有来得及看)https://www.cs.cmu.edu/~guyb/papers/gc2001.pdf