exporter 介绍
Exporter是什么
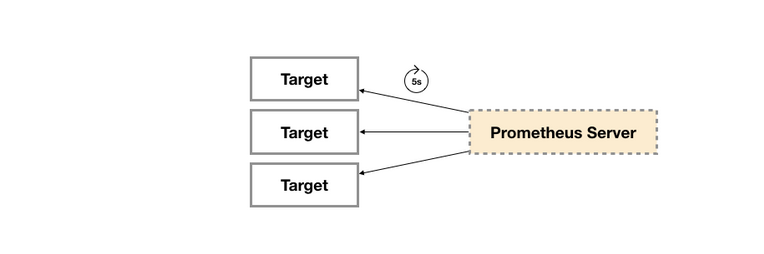
广义上讲所有可以向Prometheus提供监控样本数据的程序都可以被称为一个Exporter。而Exporter的一个实例称为target,如下所示,Prometheus通过轮询的方式定期从这些target中获取样本数据:
Exporter的来源
从Exporter的来源上来讲,主要分为两类:
- 社区提供的
Prometheus社区提供了丰富的Exporter实现,涵盖了从基础设施,中间件以及网络等各个方面的监控功能。这些Exporter可以实现大部分通用的监控需求。下表列举一些社区中常用的Exporter:
| 范围 | 常用Exporter |
|---|---|
| 数据库 | MySQL Exporter, Redis Exporter, MongoDB Exporter, MSSQL Exporter等 |
| 硬件 | Apcupsd Exporter,IoT Edison Exporter, IPMI Exporter, Node Exporter等 |
| 消息队列 | Beanstalkd Exporter, Kafka Exporter, NSQ Exporter, RabbitMQ Exporter等 |
| 存储 | Ceph Exporter, Gluster Exporter, HDFS Exporter, ScaleIO Exporter等 |
| HTTP服务 | Apache Exporter, HAProxy Exporter, Nginx Exporter等 |
| API服务 | AWS ECS Exporter, Docker Cloud Exporter, Docker Hub Exporter, GitHub Exporter等 |
| 日志 | Fluentd Exporter, Grok Exporter等 |
| 监控系统 | Collectd Exporter, Graphite Exporter, InfluxDB Exporter, Nagios Exporter, SNMP Exporter等 |
| 其它 | Blockbox Exporter, JIRA Exporter, Jenkins Exporter, Confluence Exporter等 |
- 用户自定义的
除了直接使用社区提供的Exporter程序以外,用户还可以基于Prometheus提供的Client Library创建自己的Exporter程序,目前Promthues社区官方提供了对以下编程语言的支持:Go、Java/Scala、Python、Ruby。同时还有第三方实现的如:Bash、C++、Common Lisp、Erlang,、Haskeel、Lua、Node.js、PHP、Rust等。
node exporter
介绍
node_exporter 是使用 Go 语言编写的 Prometheus exporter, 多用于收集 *NIX 内核公开的硬件或操作系统指标. 监控服务器CPU、内存、磁盘、I/O等信息.
源码解析
import 的相关包
import (
	"fmt"
	"net/http"
	_ "net/http/pprof"
	"os"
	"os/user"
	"sort"

	"github.com/prometheus/common/promlog"
	"github.com/prometheus/common/promlog/flag"

	"github.com/go-kit/kit/log"
	"github.com/go-kit/kit/log/level"
	"github.com/prometheus/client_golang/prometheus"
	"github.com/prometheus/client_golang/prometheus/promhttp"
	"github.com/prometheus/common/version"
	"github.com/prometheus/exporter-toolkit/web"
	"github.com/prometheus/node_exporter/collector"  // 收集器
	kingpin "gopkg.in/alecthomas/kingpin.v2"  // 格式化参数
)
main函数
- 首先会对参数进行解析
| 参数 | 解释 |
|---|---|
| listenAddress | node_export启动时使用的机器&端口,默认:9100; 示例: 0.0.0.0:9101. |
| metricsPath | prometheus server端采集数据的PATH,默认为/metrics. |
| disableExporterMetrics | 是否禁用Exporter, 默认值为false. |
| maxRequests | 最大QPS, 使用0禁用. 默认40 |
| disableDefaultCollectors | 是否禁用默认的收集器, 默认为false |
| configFile | 可以启用TLS或身份验证. |
http.Handle(*metricsPath, newHandler(!*disableExporterMetrics, *maxRequests, logger))
将访问metricsPath的请求注册到http.handler,当client访问改PATH时,会执行handler.ServeHTTP 函数.
newHandler(!*disableExporterMetrics, *maxRequests, logger)
func newHandler(includeExporterMetrics bool, maxRequests int, logger log.Logger) *handler {
	h := &handler{
		exporterMetricsRegistry: prometheus.NewRegistry(),
		includeExporterMetrics:  includeExporterMetrics,
		maxRequests:             maxRequests,
		logger:                  logger,
	}
	if h.includeExporterMetrics {
		h.exporterMetricsRegistry.MustRegister(
			prometheus.NewProcessCollector(prometheus.ProcessCollectorOpts{}),
			prometheus.NewGoCollector(),
		)
	}
	if innerHandler, err := h.innerHandler(); err != nil {
		panic(fmt.Sprintf("Couldn't create metrics handler: %s", err))
	} else {
		h.unfilteredHandler = innerHandler
	}
	return h  // 返回一个handler函数,
}