Highcharts 是一个用纯JavaScript编写的一个图表库, 能够很简单便捷的在web网站或是web应用程序添加有交互性的图表,并且免费提供给个人学习、个人网站和非商业用途使用。目前HighCharts支持 的图表类型有曲线图、区域图、柱状图、饼状图、散状点图和综合图表。
HighCharts使用原理如下图所示:
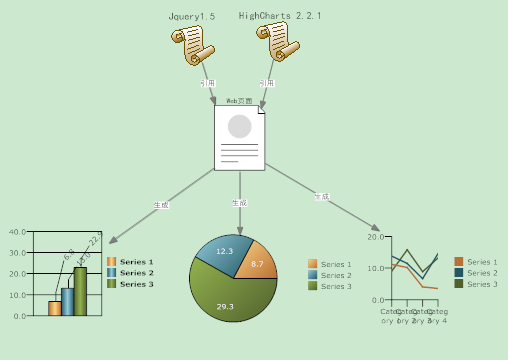
普通开发模式是在前端应用Jquery和HighChartsJS库文件,然后在<head>头中写Js脚本,例如绘制饼图Jquery脚本如下:


绘制饼图Jquery脚本

$(function () {
        $('#container').highcharts({
            chart: {
                plotBackgroundColor: null,
                plotBorderWidth: null,
                plotShadow: false
            },
            title: {
                text: 'Browser market shares at a specific website, 2010'
            },
            tooltip: {
                pointFormat: '{series.name}: <b>{point.percentage}%</b>',
                percentageDecimals: 1
            },
            plotOptions: {
                pie: {
                    allowPointSelect: true,
                    cursor: 'pointer',
                    dataLabels: {
                        enabled: true,
                        color: '#000000',
                        connectorColor: '#000000',
                        formatter: function() {
                            return '<b>'+ this.point.name +'</b>: '+ this.percentage +' %';
                        }
                    }
                }
            },
            series: [{
                type: 'pie',
                name: 'Browser share',
                data: [
                    ['Firefox',   45.0],
                    ['IE',       26.8],
                    {
                        name: 'Chrome',
                        y: 12.8,
                        sliced: true,
                        selected: true
                    },
                    ['Safari',    8.5],
                    ['Opera',     6.2],
                    ['Others',   0.7]
                ]
            }]
        });
    });
其中data属性为图表绑定数据源。但这种方式也存在明显问题:
- 前端代码量过大
- 绑定动态数据比较困难,可取的方法是使用$.AJAX异步方法解析WebServices或者一般处理程序ashx,然后对返回结果进行JSON序列化处理,比较麻烦容易出错。
- HighCharts的Js调用代码无法实现代码重用。
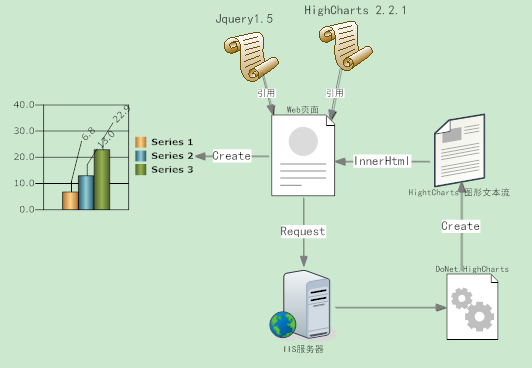
解决方案是使用第三方HighCharts组件DoNet.HighCharts, 该组件是一个服务器端生成HighCharts Js脚本的开源组件,然后通过输出流的方式插入到页面Body块的DIV中,原理如下图所示:
DoNet.HighCharts开发环境为(二选一)
- VS2008+ASP.NET MVC3+.NET 3.5
- VS2010+.NET 4.0
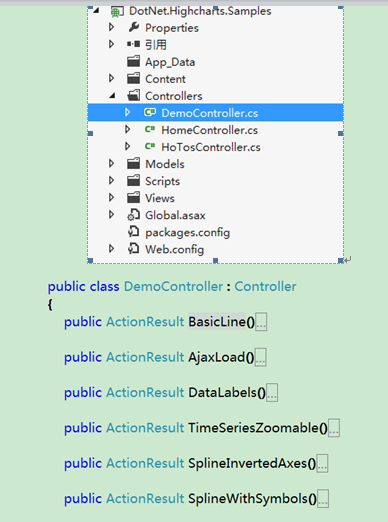
DoNet.HighCharts开源项目是以ASP.NET MVC3 Project的形式分发的,开发人员可以参考控制器文件夹Controlls中的DemoController中每种图表的后台代码(和前台HighCharts JS代码基本一致)
MVC原理在这里做简单表述,便于程序员阅读该代码。
- M:Module 模型层
- V:View 视图层
- C:Controll 控制层
当客户端发送一个Action动作时,根据动作名找到Controll控制器中相应的方法名。例如http://localhost/Charts/Demo/BasicLine,MVC框架根据全局路由配置自动映射到BasicLine控制器方法,控制器方法返回一个Result并导航到Views文件夹下的同名视图BasicLine.cshtml(cshtml可以理解为WebForm的aspx)然后加载视图。
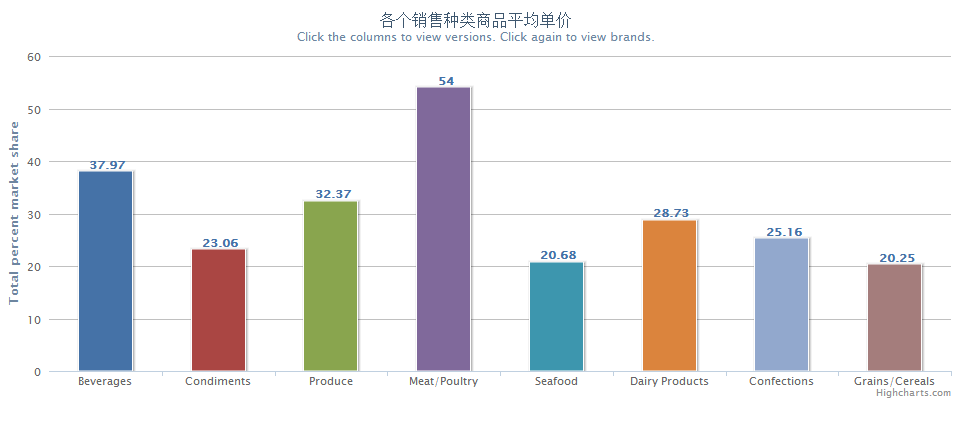
Asp.net mvc和Asp.net Web Form方式不同,所以以上MVC实现方式需要修改才能在WebForm中使用。以下以“各种类产品均价统计功能”柱形图(涉及到NorthWind数据 库的Products和Categories表)为例说明WebForm中如何使用DoNet.HighCharts。
1: 创建查询视图View_CategoryAvgPrice
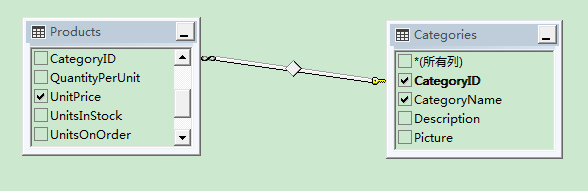
2: 创建强名称数据集NorthWind.xsd
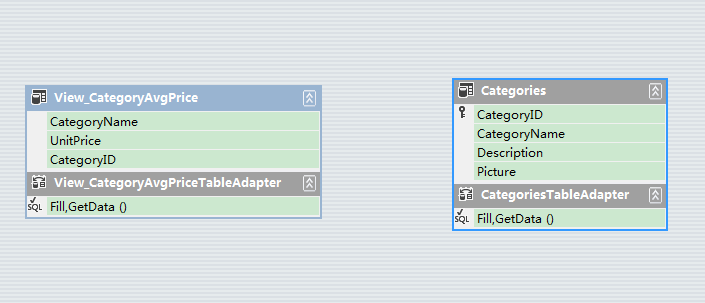
数据集分为强名称数据集和弱名称数据集(DataSet)两种,具体原理就不展开描述了。拖放View_CategoryAvgPrice和Categories表到数据集中。
3: 柱形图控制器方法(ColumnWithDrilldown)在aspx页面中的主要代码实现
柱形图控制器方法(ColumnWithDrilldown)在aspx页面中的主要代码实现

//导入DoNet.HighCharts包
using DotNet.Highcharts;
using DotNet.Highcharts.Options;
using DotNet.Highcharts.Enums;
using DotNet.Highcharts.Helpers;
using System.Drawing;
using  NorthWindTableAdapters;

/// <summary>
/// 种类商品价格统计类
/// </summary>
public class CategoryPrice
{
    public Decimal Price { set; get; }
    public string CategoryName { set; get; }
}

public partial class ColumnWithDrilldown : System.Web.UI.Page
{
    #region 创建强名称数据集表对象和数据适配器对象
private NorthWind.View_CategoryAvgPriceDataTable avgPriceDt;
avgPriceDt= new NorthWind.View_CategoryAvgPriceDataTable();
    private NorthWind.CategoriesDataTable categoryDt = new NorthWind.CategoriesDataTable();
    private View_CategoryAvgPriceTableAdapter avgPriceAdapter = new View_CategoryAvgPriceTableAdapter();
    private CategoriesTableAdapter categoryAdapter = new CategoriesTableAdapter();
    #endregion

    private List<CategoryPrice> avgPriceList=null;//绑定数据源集合
    protected void Page_Load(object sender, EventArgs e)
    {
        LoadColumnWithDrilldown();
    }

    public void LoadColumnWithDrilldown()
    {
        avgPriceAdapter.Fill(avgPriceDt);
        categoryAdapter.Fill(categoryDt);

        //按产品种类分组显示Linq表达式
         avgPriceList =
             (
                  from p in avgPriceDt
                  group p by p.CategoryID into g//根据种类编号分组
                  select new CategoryPrice
                  {
                      //种类名称
                      CategoryName=categoryDt.First(c=>c.CategoryID==g.Key).CategoryName,
                      //种类商品均价
                      Price = g.Average(c => c.UnitPrice)
                  }
              ).ToList();

        //显示柱形图的种类名称数组
        string[] categories = new string[avgPriceList.Count()];
        int index = 0;
        foreach (var item in avgPriceList)
        {
            categories[index++] = item.CategoryName;
        }
        Data data = LoadDate();//柱形图动态绑定的数据源
       //省略HighCharts脚本代码,同mvc代码
        div1.InnerHtml = chart.ToHtmlString();//转换为HighCharts的客户端脚本插入到div1中
}
   //根据汇总的种类商品创建柱形图节点对象的方法
    private  Data LoadDate()
    {
            Data data = null;
            int index =-1;
           //创建柱形图显示的节点对象
            DotNet.Highcharts.Options.Point []pointList=new DotNet.Highcharts.Options.Point[avgPriceList.Count];
            foreach (var item in avgPriceList)
            {
                pointList[++index] = new DotNet.Highcharts.Options.Point
                {
                    Y = (Number)(item.Price*100)/100.0,
                    Color = Color.FromName(string.Format("colors[{0}]", index))
                };

            }
            data = new Data(pointList);
            return data;

    }
}
显示效果如下图所示:
开源项目DoNet.HighCharts网址:http://dotnethighcharts.codeplex.com/
HighCharts Jquery网址:http://www.highcharts.com/demo/