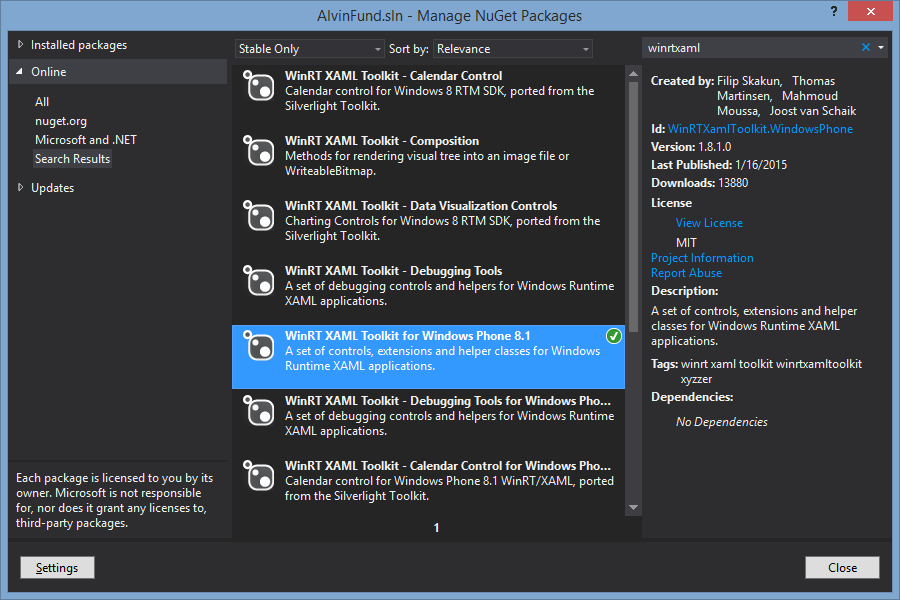
【注1】WinRTXamlToolkit是免费控件,不过很久不更新了,而且网上的资源很少。后来我发现syncfusion控件有免费的community版本,并且有详细文档,所以就转过去使用syncfusion了。继续在WinRT/UWP奋战的亲们可以去围观一下:https://www.syncfusion.com/products/communitylicense
【注2】.Net平台各种免费和收费的包含Chart的控件:WinRTXamlToolkit/ModernUI/Visifire/Telerik/Syncfusion
【注3】WinRTXamlToolkit示例:http://eren.ws/2013/10/15/using-graphs-and-charts-in-windows-store-apps-boredom-challenge-day-11/

xmlns:Charting="using:WinRTXamlToolkit.Controls.DataVisualization.Charting"
<Grid Background="{StaticResource ApplicationPageBackgroundThemeBrush}">
        <Charting:Chart x:Name="PieChart" HorizontalAlignment="Left" VerticalAlignment="Top" Margin="100,100,0,0" Width="400" Height="400">
            <Charting:PieSeries Margin="0" IndependentValuePath="Name" DependentValuePath="Amount" IsSelectionEnabled="True"/>
        </Charting:Chart>
        <Button x:Name="ButtonRefresh" Content="Refresh" HorizontalAlignment="Left" Margin="100,57,0,0" VerticalAlignment="Top" Click="ButtonRefresh_Click"/>
        <Charting:Chart x:Name="ColumnChart" HorizontalAlignment="Left" VerticalAlignment="Top" Margin="505,100,0,0" Width="399" Height="400">
            <Charting:ColumnSeries Title="Smartphone Companies" Margin="0" IndependentValuePath="Name" DependentValuePath="Amount" IsSelectionEnabled="True"/>
        </Charting:Chart>
        <Charting:Chart x:Name="LineChart" HorizontalAlignment="Left" VerticalAlignment="Top" Margin="909,100,-143,0" Width="600" Height="400">
            <Charting:LineSeries Title="Smartphone Companies" Margin="0" IndependentValuePath="Name" DependentValuePath="Amount" IsSelectionEnabled="True"/>
        </Charting:Chart>
        <Charting:Chart x:Name="BarChart" HorizontalAlignment="Left" VerticalAlignment="Top" Margin="100,505,0,-137" Width="600" Height="400">
            <Charting:BarSeries Title="Smartphone Companies" Margin="0" IndependentValuePath="Name" DependentValuePath="Amount" IsSelectionEnabled="True"/>
        </Charting:Chart>
        <Charting:Chart x:Name="BubbleChart" HorizontalAlignment="Left" VerticalAlignment="Top" Margin="705,505,0,-137" Width="600" Height="400">
            <Charting:BubbleSeries Title="Smartphone Companies" Margin="0" IndependentValuePath="Name" DependentValuePath="Amount" IsSelectionEnabled="True"/>
        </Charting:Chart>
    </Grid>
        public class FinancialStuff
        {
            public string Name { get; set; }
            public int Amount { get; set; }
        }

        private void LoadChartContents()
        {
            Random rand = new Random();
            List<FinancialStuff> financialStuffList = new List<FinancialStuff>();
            financialStuffList.Add(new FinancialStuff() { Name = "MSFT", Amount = rand.Next(0, 200) });
            financialStuffList.Add(new FinancialStuff() { Name = "AAPL", Amount = rand.Next(0, 200) });
            financialStuffList.Add(new FinancialStuff() { Name = "GOOG", Amount = rand.Next(0, 200) });
            financialStuffList.Add(new FinancialStuff() { Name = "BBRY", Amount = rand.Next(0, 200) });
            (PieChart.Series[0] as PieSeries).ItemsSource = financialStuffList;
            (ColumnChart.Series[0] as ColumnSeries).ItemsSource = financialStuffList;
            (LineChart.Series[0] as LineSeries).ItemsSource = financialStuffList;
            (BarChart.Series[0] as BarSeries).ItemsSource = financialStuffList;
            (BubbleChart.Series[0] as BubbleSeries).ItemsSource = financialStuffList;
        }
也可以先将Series弄出来:
        public static LineSeries InitChart(List<FinancialStuff> financialStuffList)
        {
            LineSeries lSeries = new LineSeries();
            lSeries.IndependentValuePath = "Name";
            lSeries.DependentValuePath = "Amount";

            lSeries.ItemsSource = financialStuffList;

            return lSeries;
        }
 LineSeries ls = Functions.WinrtChartHelper.InitChart(financialStuffList);
                    this.LineChart.Series.Add(ls);
然而,这样子只能实现LineSeries ,PieSeries/ColumnSeries/BarSeries/BubbleSeries等都会有一个UnhandledException出现……