Your page is showing high CPU usage and spinning up your laptop fan, but nothing is visibly happening. What is it doing, and why is it so slow?
This lesson is a real-world performance diagnosis of this very page, right here on egghead. Two infinite (but hidden) animations were causing CPU usage to spike, and Chrome's Task Manager and Performance tools helped uncover the elements causing the problem. You'll see how to use the profiler to record a snapshot, and learn a trick for discovering animations running in the background.
There numbers of things you can do to detect a slow page
1. Check the CPU usage
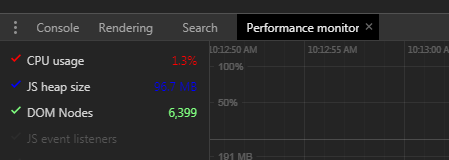
2. Bring up the chrome dev tool, performance monitor, pretty much you can say above 10% CPU usage is high
3. Record the Performance in dev tool to see any 'Layout' event, usually Layout event cause the DOM re-render, so we need to be carefully about this.
If there is such, check which element it is and try to solve the problem. For example, a hidden svg loading spinner, can cause the problem, we can set it to 'display: none', so it remove from the DOM
4. If there is any animation happens, we can do:
window.onanimationiteration = console.log
It will prints out when animation happens, so we can know that whether there is any unnecessary animation in the background.