Up until now we've just looked at bar charts. A handy chart, no doubt, but D3 offers a variety of charts you can work with. In this lesson we'll convert the bar chart into a basic scatter (or bubble) chart.
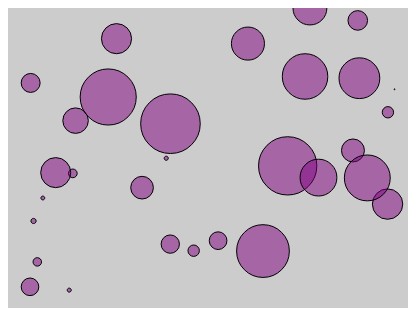
<!DOCTYPE html>
<html>
<head lang="en">
    <meta charset="UTF-8">
    <title></title>
    <script src="../bower_components/underscore/underscore-min.js"></script>
    <script src="../ventor/d3.min.js"></script>
    <style type="text/css">

        body
        {
            padding-top: 50px;
            padding-left: 100px;

        }

        #chartArea {
            width: 400px;
            height: 300px;
            background-color: #CCC;
        }

        .bar
        {
            display: inline-block;
            width: 20px;
            height: 75px; /* Gets overriden by D3-assigned height below */
            margin-right: 2px;
           /* fill: teal; *//* SVG doesn't have background prop, use fill instead*/
            z-index:99;
        }

        .bubble {
            display: inline-block;
            fill: purple;
            fill-opacity: 0.5;
            stroke: black;
            stroke-weight: 1px;
        }

    </style>
</head>
<body>
<section id="chartArea"></section>
<script>
    var dataset = _.map(_.range(30), function(num) {
        return {
            x: Math.random() * 100,
            y: Math.random() * 100,
            r: Math.random() * 30
        }

    }), //reandom generate 15 data from 1 to 50
            margin = {top: 0, bottom: 0, left: 0, right: 0},
            w = 400 - margin.left - margin.right,
            h = 300 -margin.top - margin.bottom;

    var svg = d3.select('#chartArea').append('svg')
            .attr('width', w + margin.left + margin.right)
            .attr('height', h + margin.top + margin.bottom)
            .append('g') //The last step is to add a G element which is a graphics container in SBG.
            .attr('transform', 'translate(' + margin.left + ', ' + margin.top + ')'); //Then offset that graphic element by our left and top margins.

    var yScale = d3.scale.linear()
            .domain([0, d3.max(dataset, function(d) {
                return d.y; //tell the max function just need to care about y prop
            })])
            .range([h, 0]);

    var xScale = d3.scale.linear()
            .domain([0, 100])
            .range([0, w]);

    svg.selectAll('circle')
            .data(dataset)
            .enter()
            .append('circle')// svg doesn't have div, use rect instead
            .attr('class', "bubble")
            .attr('cx', function(each_data, index){
                return xScale(each_data.x);
            })
            .attr('cy', function(each_data){
                return yScale(each_data.y);
            })
            .attr('r', function(each_data, i){
                return each_data.r;
            });
</script>
</body>
</html>