It would be helpful once you can see what information have been tracking inside you web application,
We can use Teailumn debugger for that, inside Chrome,
"Bookmarks" --> "Bookmark manager" --> "Settings" --> "Add new bookmark"
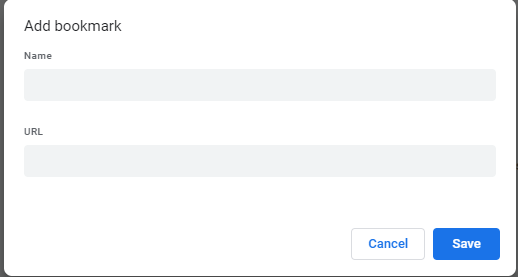
Give a "name" and paste the URL below:
javascript:void(window.open("","utagmon","width=600,height=600,location=0,menubar=0,status=1,toolbar=0,resizable=1,scrollbars=1").document.write("<script language='JavaScript' id='utagmon'src='//tags.tiqcdn.com/utag/tealium-solutions/main/prod/utag.4.js?opt_show_enrich=0&opt_show_meta=0&opt_show_tiq=1&opt_show_dom=0&opt_show_jspage=0&opt_show_cookie=0&_cb="+Math.random() +"'></"+"script>"))
Then in the bookmark bar, you will see the bookmark you created:
When you want to debugger the website, just click open the dubbger.