绘制类似的3D饼图时,echart已经无法满足要求了!
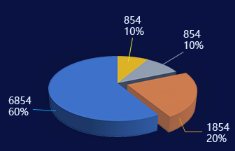
百度查找使用highcharts就可以了。可以参考官方文档:https://api.highcharts.com.cn/highcharts
直接复制DEMO代码就可以云行了
<html>
<head>
    <meta charset="UTF-8" />
    <title>饼图</title>
    <script src="https://cdn.staticfile.org/jquery/1.10.2/jquery.min.js"></script>
    <script src="https://cdn.highcharts.com.cn/highcharts/highcharts.js"></script>
    <script src="https://cdn.highcharts.com.cn/highcharts/highcharts-3d.js"></script>
</head>
<body>
<div id="container" style=" 550px; height: 400px; margin: 0 auto"></div>
<script type="text/javaScript">

    var pieColors = (function () {     // 此处是基础着色,如果设置好颜色,此处就没有看的必要了
        var colors =[],
            base = Highcharts.getOptions().colors[0],
            i;

        for (i = 0; i < 10; i += 1) {
            // Start out with a darkened base color (negative brighten), and end
            // up with a much brighter color
            colors.push(Highcharts.Color(base).brighten((i - 3) / 7).get());
        }
        return colors;
    }());
    $(document).ready(function() {
        var chart = {
            type: 'pie',
            options3d: {
                enabled: true,
                alpha: 45,
                beta: 0
            }
        };
        var title = {
            text: '测试占有率'
        };
        var tooltip = {
            pointFormat: '{series.name}: <b>{point.percentage:.1f}%</b>'
        };
        var colors=['#FF0000','#00FF00','#0000FF','#FFFF00','#00FFFF','#FF00FF'];    //设置饼图颜色
        var credits =  {
            enabled: false    //禁用版权url    此处不设置,  会显示highecharts.com
        };
        var plotOptions = {
            pie: {
                allowPointSelect: true,
                cursor: 'pointer',
                depth: 25, //饼图厚度
                // color:pieColors,
                dataLabels: {
                    distance: 20,//设置引导线的长度
                    // color:'red',//全局设置字体颜色
                    enabled: true,
                    // format: '{point.name}',
                    formatter: function() {     //设置字体与引导线和饼图颜色一致
                        if(this.point.name == '中国'){
                            return '<span style="color:#FF0000">['+ this.point.name +' '+ Highcharts.numberFormat(this.percentage, 2)+'%]</span>';
                        }else if(this.point.name == '美国'){
                            return '<span style="color:#00FF00">['+ this.point.name +' '+ Highcharts.numberFormat(this.percentage, 2)+'%]</span>';
                        }else if(this.point.name == '俄罗斯'){
                            return '<span style="color:#0000FF">['+ this.point.name +' '+Highcharts.numberFormat(this.percentage, 2)+'%]</span>';
                        }else if(this.point.name == '英国'){
                            return '<span style="color:#FFFF00">['+ this.point.name +' '+ Highcharts.numberFormat(this.percentage, 2)+'%]</span>';
                        }else if(this.point.name == '朝鲜'){
                            return '<span style="color:#00FFFF">['+ this.point.name +' '+ Highcharts.numberFormat(this.percentage, 2)+'%]</span>';
                        }else if(this.point.name == '日本'){
                            return '<span style="color:#FF00FF">['+ this.point.name +' '+ Highcharts.numberFormat(this.percentage, 2)+'%]</span>';
                        }
                    }
                    /* style: {
                         fontSize: '10px',//设置字体大小
                         fontFamily: 'Verdana, sans-serif'
                     }*/
                }
            }

        };
        var series= [{
            type: 'pie',
            name: 'Browser share',
            startAngle: 180,//调整饼图的角度   方向:顺时针
            data: [
                ['中国',   45.0],
                ['美国',       16.8],
                {
                    name: '俄罗斯',
                    y: 22.8,
                    sliced: true,
                    selected: true
                },
                ['英国',    8.5],
                ['朝鲜',     6.2],
                ['日本',   0.1]
            ]
        }];

        var json = {};
        json.chart = chart;
        json.title = title;
        json.tooltip = tooltip;
        json.colors = colors;   // 设置饼图颜色
        json.credits = credits;
        json.plotOptions = plotOptions;
        json.series = series;
        $('#container').highcharts(json);
    });
</script>
</body>
</html>
遇到问题:文字总是有白色描边,去掉办法:
style:{
  color:'#eee',
  fontSize:'14px',
  textOutline:"none"
}

转自于:https://www.cnblogs.com/xiaomg/articles/10382506.html