1.matplotlib-折线图
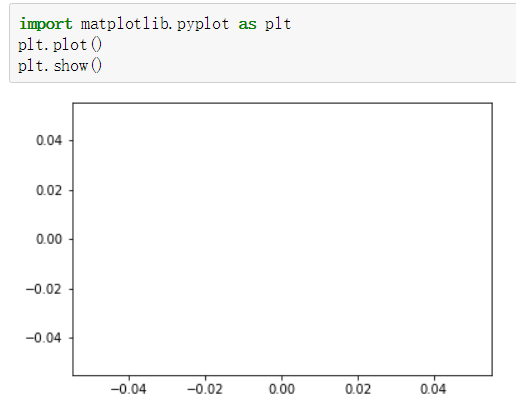
首先也是导入库 : import matplotlib.pyplot as plt
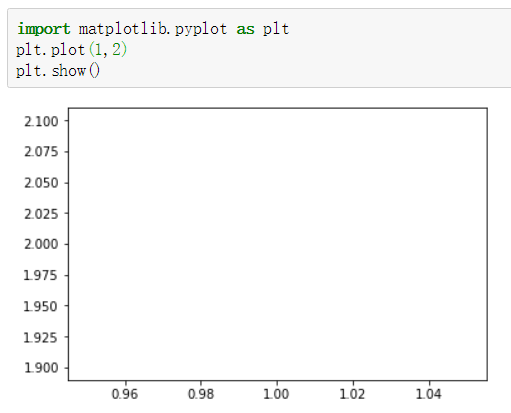
plt.plot() 不传值空白折线图
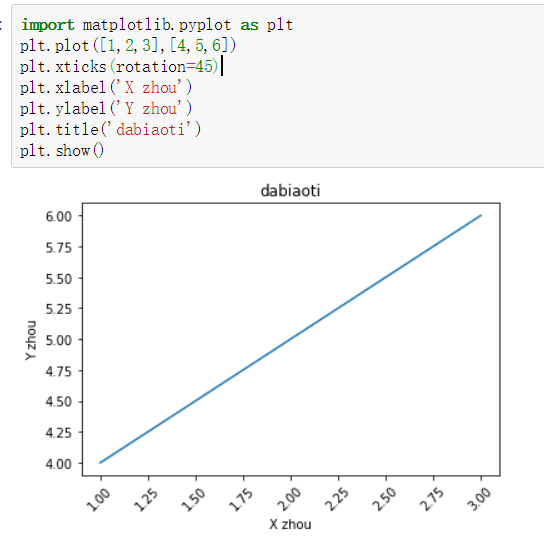
plt.plot(a,b) a是x轴,b为y轴 注意:a,b为单值时就一个点
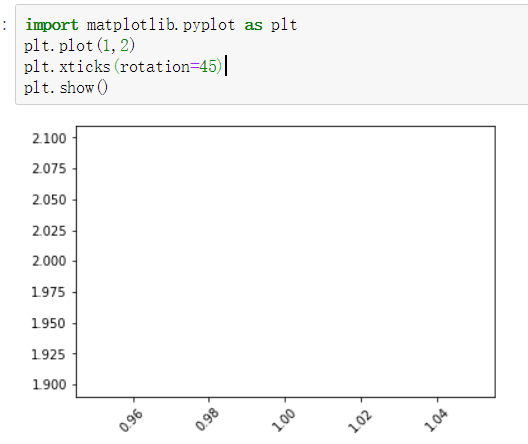
plt.xticks(rotation=45) 改变样式,x轴数坐标转45度
plt.yticks(ratation=45) 同理 y轴。。。
plt.xlabel('我是X轴')
plt.ylabel('我是y轴')
plt.title('我是大标题') 写的时候,本人nodebook不识别汉字,这里就不改了
plt.show() 展示
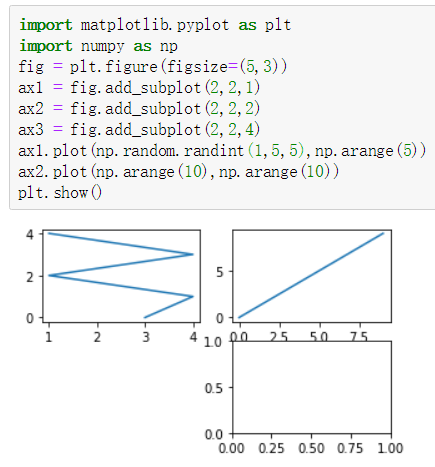
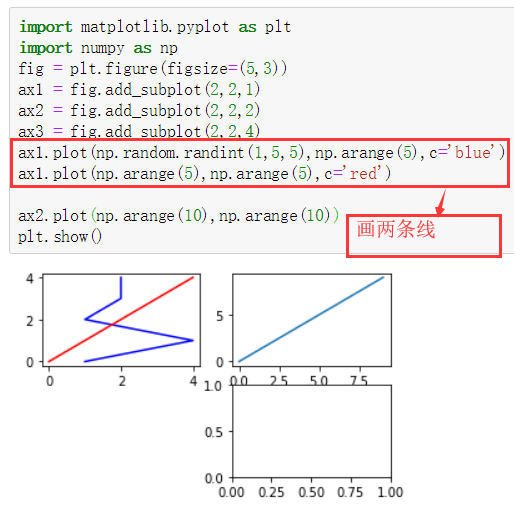
2.matplotlib-子图操作
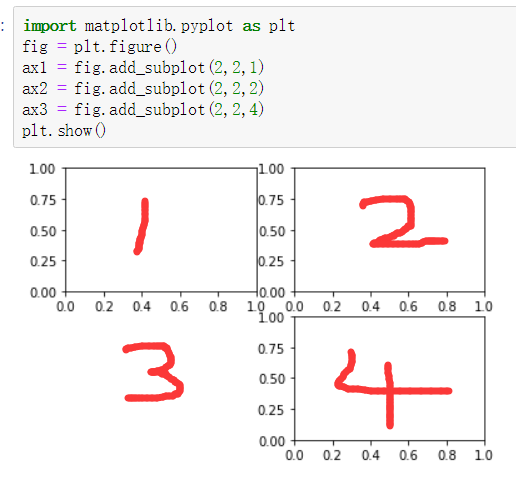
plt.figure()  默认一个画图的区间       输出为:<Figure size 432x288 with 0 Axes>
add_subplot(a,b,c)       如: a=2,b=3 组成一个矩阵 2行3列  c代表这个矩阵在区间的位置,排序规则见下
plt.figure(figsize=(5,3)) 5,3 代表矩阵的长宽
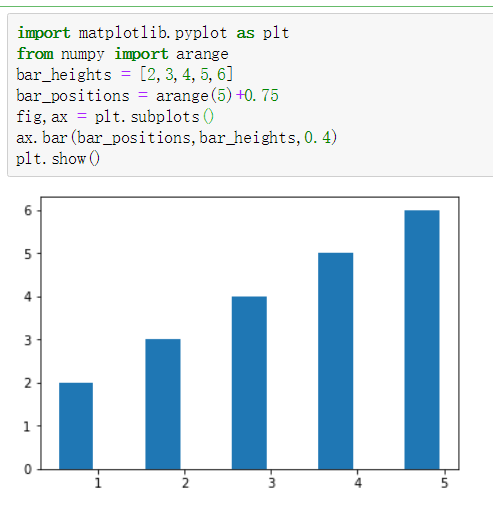
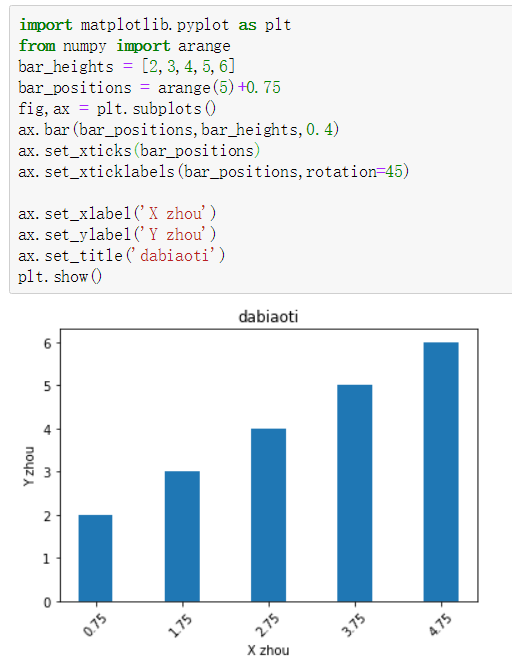
3.matplotlib-条形图与散点图
bar_heights = [2,3,4,5,6]              bar:柱,柱的高度   Y轴
bar_positions = arange(5)+0.75       柱的位置(与坐标原点的距离,X轴)
fig,ax = plt.subplots()                   fig不能丢,不然图出不来,不知道为什么0.0    fig--figure,(figsize)可以看大小,前面博客中有
ax.bar(bar_positions,bar_heights,0.4)         第三个参数是柱本身的宽度
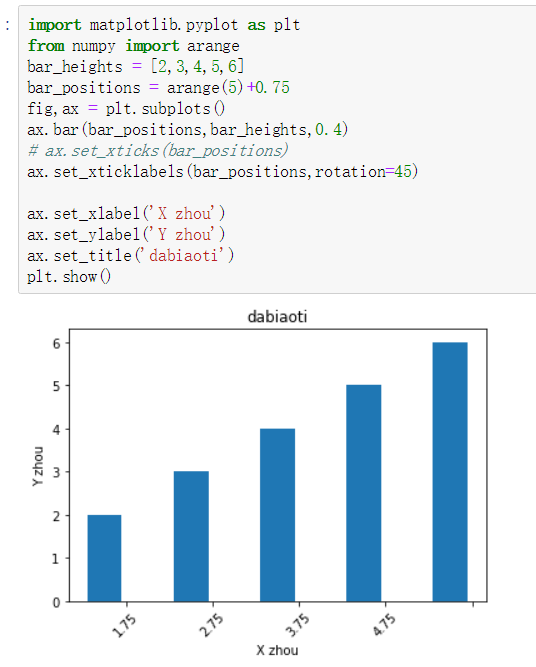
# ax.set_xticks(bar_positions)          这个的意思 看下面两图对比吧,不会说了
ax.set_xticklabels(bar_positions,rotation=45)

ax.set_xlabel('X zhou')
ax.set_ylabel('Y zhou')
ax.set_title('dabiaoti')
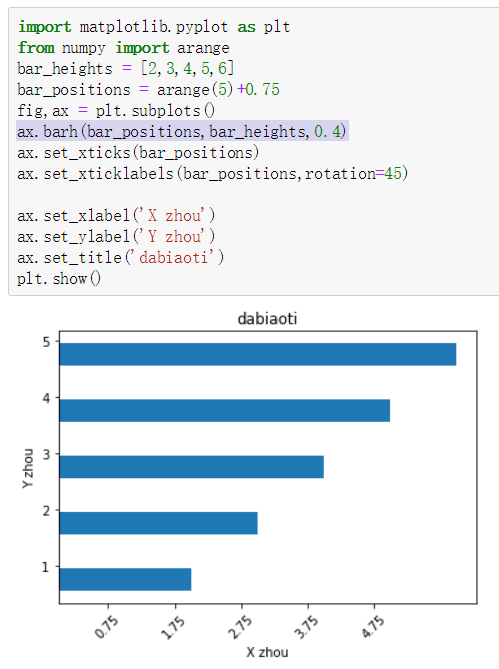
ax.barh(bar_positions,bar_heights,0.4) barh -- 看效果,自己悟
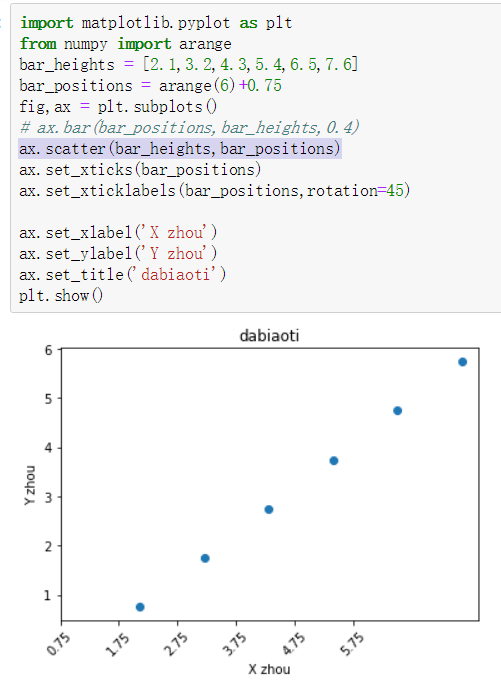
3.1散点图
ax.scatter(bar_heights,bar_positions) scatter:散点图
4.matplotlib-柱形图与盒图
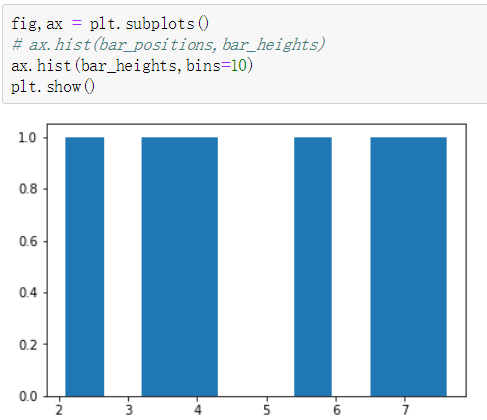
ax.hist(bar_positions) .hist--带有bin结构的图,不写有默认bin值
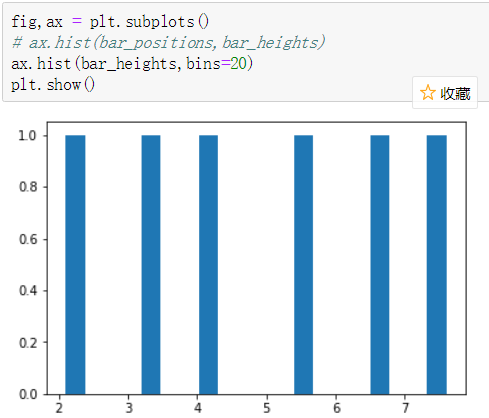
ax.hist(bar_heights,range(3,4),bins=20) range(3,4)去掉3之前和4之后的值
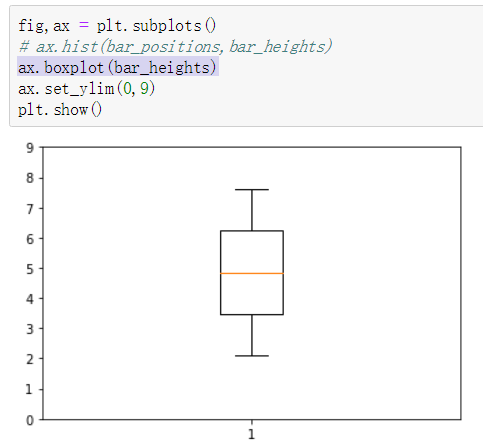
ax.boxplot(bar_heights) 盒图
ax.set_ylim(0,5) y轴坐标为0,1,2,3,4,5,6....