MySQL插入性能优化
对于默认安装的mysql,进行insert插入测试,发现QPS很低
通过iostat -x 1发现磁盘的IO很高
SHOW VARIABLES LIKE 'sync_binlog';
SHOW VARIABLES LIKE 'innodb_flush_log_at_trx_commit';
SHOW VARIABLES LIKE 'innodb_flush_method';
SHOW VARIABLES LIKE 'innodb_buffer_pool_size';
SHOW VARIABLES LIKE 'innodb_io_capacity';
sync_binlog:二进制日志文件binlog的刷新写入方式
- sync_binlog=0(默认值为0)
表示binlog不控制binlog的刷新,由文件系统自己控制它的缓存的刷新。这时候的性能是最好的(???),但是风险也是最大的。因为一旦系统Crash,在binlog_cache中的所有binlog信息都会被丢失。 - sync_binlog=n(大于0的其他值)
表示每进行n次事务提交,mysql主动调用文件系统,将缓存刷新到磁盘中
innodb_flush_log_at_trx_commit:指定了 InnoDB 在事务提交后的日志写入方式
- innodb_flush_log_at_trx_commit=0(性能最高,安全性最差)
log buffer 会 每秒写入到日志文件并刷写(flush)到磁盘,不受每次事务提交的影响,也就是 log buffer 的刷写操作和事务提交操作没有关系。
在这种情况下,MySQL性能最好,但如果 mysqld 进程崩溃,通常会导致最后 1s 的日志丢失。 - innodb_flush_log_at_trx_commit=1(默认值,性能最差,安全性最高)
每次事务提交时,log buffer 会被写入到日志文件并刷写到磁盘。
这是最安全的配置,但由于每次事务都需要进行磁盘I/O,所以也最慢。 - innodb_flush_log_at_trx_commit=2(一般应该设置为2,折中方案)
每次事务提交会写入日志文件,但并不会立即刷写到磁盘,日志文件会每秒刷写一次到磁盘。
这时如果 mysqld 进程崩溃,由于日志已经写入到系统缓存,所以并不会丢失数据;在操作系统崩溃的情况下,通常会导致最后 1s 的日志丢失。
innodb_flush_method:这个参数控制着innodb数据文件及redo og的打开、刷写模式,有以下几种设置:
- 默认是fdatasync,调用fsync()去刷数据文件与redo log的buffer
- 为O_DSYNC时,innodb会使用O_SYNC方式打开和刷写redo log,使用fsync()刷写数据文件,通常比较慢。
- 为O_DIRECT时,innodb使用O_DIRECT打开数据文件,使用fsync()刷写数据文件跟redo log,在Linux上使用Direct IO,可以显著提高速度,特别是在RAID系统上,避免额外的数据复制和double buffering(mysql buffering 和OS buffering)。
innodb_buffer_pool_size:这是Innodb最重要的一个配置参数,这个参数控制Innodb本身的缓大小,也影响到,多少数据能在缓存中。建议该参数的配置在物理内存的70%-80%之间。
innodb_io_capacity:动态调整刷新脏页的数量。默认是200,单位是页。
该参数设置的大小取决于硬盘的IOPS,即每秒的输入输出量(或读写次数)。
至于什么样的磁盘配置应该设置innodb_io_capacity参数的值是多少,可参考:
动态设置(也可以在配置文件中设置)
SET GLOBAL sync_binlog = 100;
SET GLOBAL innodb_flush_log_at_trx_commit = 2;
SET GLOBAL innodb_io_capacity = 2000;
[mysqld]
# 配置性能优化
sync_binlog = 100
innodb_flush_log_at_trx_commit = 2
# O_DIRECT (避免双缓冲技术)
innodb_flush_method = O_DIRECT
# 设置为 RAM 大小的 50%-70%,不需要大于数据库的大小
innodb_buffer_pool_size = 6G
# 128M – 2G (不需要大于 buffer pool)
innodb_log_file_size = 2G
innodb_io_capacity = 2000
MongoDB聚合查询性能
TODO
使用kafka生产者,内存增长过快,频繁full gc
当kafka性能较差的时候,生产者可以设置批量发送,提高性能,同时可以解决内存占用过大的问题
大数据量入库方案的优化
场景:业务需要将大量的请求&响应消息写入mongo
方案一:直接写入(缺点:受mongo写入限制,速度慢)
方案二:使用队列,多线程写入(缺点:多线程并发写入容易导致mongo的资源占用忽高忽低,不稳定,表现为QPS忽高忽低)
方案三:由于kafka写入速度更快,先将数据写入kafka,然后起一个消费者慢慢入库
客户端网络状况较差对服务器的影响
待测试
springboot应用压力上不去的原因分析
???
服务器的QPS不稳定,波动很大
- 有可能是磁盘IO方面的问题,先从磁盘IO入手排查
- 有可能是GC导致(Java应用)
- 排查定时任务的影响
Redis中的大key(没遇到过)
参考
大key(bigkey)是指 key 的 value 是个庞然大物,例如 Hashes, Sorted Sets, Lists, Sets,日积月累之后,会变得非常大,可能几十上百MB,甚至到GB。
如果对这类大key直接使用 del 命令进行删除,会导致长时间阻塞,甚至崩溃。
因为 del 命令在删除集合类型数据时,时间复杂度为 O(M),M 是集合中元素的个数。
Redis 是单线程的,单个命令执行时间过长就会阻塞其他命令,容易引起雪崩。
CPU更换会导致性能测试结果不一致
某次性能测试,在特定场景下,CPU占用达到10%
一段时间后复测,发现相同环境,相同测试条件下,CPU占用超过20%
是更换了CPU导致的
PS. 可以通过在不同环境,如:阿里云和本地环境,相同配置,对比性能差异
一次fullgc问题排查
获取dump文件
内存dump
jmap -dump:format=b,file=temp.dump 209669
压缩之后效果明显
tar czvf temp.dump.tgz temp.dump
分析
TODO
php项目,由哨兵读写切换到master读slave写之后,服务器CPU升高
对比之前测试结果,怀疑是由于增加了一个redis连接过程导致的(待验证)
网卡多队列问题

如图:核心4的si很高(其他核心完全没有压力),再加上us和sy,已经基本满载,压力无法继续增长
查看中断信息
# -d(高亮显示不同)-n(时间间隔)
# 查看软中断信息
$ watch -d -n 1 'cat /proc/softirqs'
Every 1.0s: cat /proc/softirqs                                                                                                                                                                                    Tue Aug  4 11:50:44 2020

                    CPU0       CPU1       CPU2       CPU3       CPU4       CPU5       CPU6       CPU7
          HI:          1          0          1          0          0          0          0          0
       TIMER:   54781652   81663642   70986050   77070151  178122347   67691843   65064022   63776794
      NET_TX:         35         26         46         39       5980        428         61         30
      NET_RX:    1000783    1326122    1145066    1585512  130222092     315671     314158     315617
       BLOCK:       2249          0    1573263          0    3187153      77933     144284     119590
BLOCK_IOPOLL:          0          0          0          0          0          0          0          0
     TASKLET:       2833       2702       2490       2581       3647       5016       6108       5736
       SCHED:   25372471   44086994   35319101   43085487   72355559   31544402   31686817   31622517
     HRTIMER:          0          0          0          0          0          0          0          0
         RCU:   33682053   38010549   35206234   35455568   79230163   36428085   33815438   33081089

# 查看硬中断信息
$ watch -d -n 1 'cat /proc/interrupts'
Every 1.0s: cat /proc/interrupts                                                                                                                                                                                  Tue Aug  4 11:51:34 2020

           CPU0       CPU1       CPU2       CPU3       CPU4       CPU5       CPU6       CPU7
  0:        157          0          0          0          0          0          0          0   IO-APIC-edge      timer
  1:         10          0          0          0          0          0          0          0   IO-APIC-edge      i8042
  6:          3          0          0          0          0          0          0          0   IO-APIC-edge      floppy
  8:          1          0          0          0          0          0          0          0   IO-APIC-edge      rtc0
  9:          0          0          0          0          0          0          0          0   IO-APIC-fasteoi   acpi
 10:    3128824          0          0          0          0          0          0          0   IO-APIC-fasteoi   virtio0
 11:         34          0          0          0          0          0          0          0   IO-APIC-fasteoi   uhci_hcd:usb1
 12:         15          0          0          0          0          0          0          0   IO-APIC-edge      i8042
 14:          0          0          0          0          0          0          0          0   IO-APIC-edge      ata_piix
 15:        134          0          0          0    6113276          0          0          0   IO-APIC-edge      ata_piix
 24:          0          0          0          0          0          0          0          0   PCI-MSI-edge      virtio1-config
 25:          0          0          0          0          0          0          0          0   PCI-MSI-edge      virtio1-control
 26:          0          0          0          0          0          0          0          0   PCI-MSI-edge      virtio1-event
 27:       3928          0    2020590          0          0          0          0          0   PCI-MSI-edge      virtio1-request
 28:          0          0          0          0          0          0          0          0   PCI-MSI-edge      virtio3-config
 29:        245          0          0          0  129489889          0          0          0   PCI-MSI-edge      virtio3-input.0
 30:       2665          0          0          0          0          0          0          0   PCI-MSI-edge      virtio3-output.0
 31:          0          0          0          0          0          0          0          0   PCI-MSI-edge      virtio2-config
 32:         24          0          0          0        163          0          0          0   PCI-MSI-edge      virtio2-virtqueues
NMI:          0          0          0          0          0          0          0          0   Non-maskable interrupts
LOC:  117496431  145560317  135564227  144897852  253495896  132232223  129489879  127900756   Local timer interrupts
SPU:          0          0          0          0          0          0          0          0   Spurious interrupts
PMI:          0          0          0          0          0          0          0          0   Performance monitoring interrupts
IWI:    2014539    2436698    2192873    2214987   16802361    1859998    1729236    1756322   IRQ work interrupts
RTR:          0          0          0          0          0          0          0          0   APIC ICR read retries
RES:   37242930   32193980   31128382   30542905   28653311   40686633   36117712   34502154   Rescheduling interrupts
CAL: 4294965800 4294965696 4294965962 4294965759     129026      76003     142462     117692   Function call interrupts
TLB:    2451462    2725212    2388287    2295359    2210189    2412439    2138699    2096039   TLB shootdowns
TRM:          0          0          0          0          0          0          0          0   Thermal event interrupts
THR:          0          0          0          0          0          0          0          0   Threshold APIC interrupts
DFR:          0          0          0          0          0          0          0          0   Deferred Error APIC interrupts
MCE:          0          0          0          0          0          0          0          0   Machine check exceptions
MCP:      20868      20868      20868      20868      20868      20868      20868      20868   Machine check polls
ERR:          0
MIS:          0
PIN:          0          0          0          0          0          0          0          0   Posted-interrupt notification event
NPI:          0          0          0          0          0          0          0          0   Nested posted-interrupt event
PIW:          0          0          0          0          0          0          0          0   Posted-interrupt wakeup event
查看系统是否支持多队列网卡
# 显示详细的pci设备信息,v越多,越详细,当然,上限3个,这里要看Ethernet controller中的MSI-X: Enable+数据
$ lspci -vvv
00:00.0 Host bridge: Intel Corporation 440FX - 82441FX PMC [Natoma] (rev 02)
        Subsystem: Red Hat, Inc. Qemu virtual machine
        Control: I/O+ Mem+ BusMaster- SpecCycle- MemWINV- VGASnoop- ParErr- Stepping- SERR- FastB2B- DisINTx-
        Status: Cap- 66MHz- UDF- FastB2B- ParErr- DEVSEL=fast >TAbort- <TAbort- <MAbort- >SERR- <PERR- INTx-

00:01.0 ISA bridge: Intel Corporation 82371SB PIIX3 ISA [Natoma/Triton II]
        Subsystem: Red Hat, Inc. Qemu virtual machine
        Physical Slot: 1
        Control: I/O+ Mem+ BusMaster- SpecCycle- MemWINV- VGASnoop- ParErr- Stepping- SERR- FastB2B- DisINTx-
        Status: Cap- 66MHz- UDF- FastB2B- ParErr- DEVSEL=medium >TAbort- <TAbort- <MAbort- >SERR- <PERR- INTx-

00:01.1 IDE interface: Intel Corporation 82371SB PIIX3 IDE [Natoma/Triton II] (prog-if 80 [Master])
        Subsystem: Red Hat, Inc. Qemu virtual machine
        Physical Slot: 1
        Control: I/O+ Mem+ BusMaster+ SpecCycle- MemWINV- VGASnoop- ParErr- Stepping- SERR- FastB2B- DisINTx-
        Status: Cap- 66MHz- UDF- FastB2B+ ParErr- DEVSEL=medium >TAbort- <TAbort- <MAbort- >SERR- <PERR- INTx-
        Latency: 0
        Region 0: [virtual] Memory at 000001f0 (32-bit, non-prefetchable) [size=8]
        Region 1: [virtual] Memory at 000003f0 (type 3, non-prefetchable)
        Region 2: [virtual] Memory at 00000170 (32-bit, non-prefetchable) [size=8]
        Region 3: [virtual] Memory at 00000370 (type 3, non-prefetchable)
        Region 4: I/O ports at c0c0 [size=16]
        Kernel driver in use: ata_piix
        Kernel modules: ata_piix, pata_acpi, ata_generic

00:01.2 USB controller: Intel Corporation 82371SB PIIX3 USB [Natoma/Triton II] (rev 01) (prog-if 00 [UHCI])
        Subsystem: Red Hat, Inc. QEMU Virtual Machine
        Physical Slot: 1
        Control: I/O+ Mem+ BusMaster+ SpecCycle- MemWINV- VGASnoop- ParErr- Stepping- SERR- FastB2B- DisINTx-
        Status: Cap- 66MHz- UDF- FastB2B- ParErr- DEVSEL=fast >TAbort- <TAbort- <MAbort- >SERR- <PERR- INTx-
        Latency: 0
        Interrupt: pin D routed to IRQ 11
        Region 4: I/O ports at c080 [size=32]
        Kernel driver in use: uhci_hcd

00:01.3 Bridge: Intel Corporation 82371AB/EB/MB PIIX4 ACPI (rev 03)
        Subsystem: Red Hat, Inc. Qemu virtual machine
        Physical Slot: 1
        Control: I/O+ Mem+ BusMaster- SpecCycle- MemWINV- VGASnoop- ParErr- Stepping- SERR- FastB2B- DisINTx-
        Status: Cap- 66MHz- UDF- FastB2B+ ParErr- DEVSEL=medium >TAbort- <TAbort- <MAbort- >SERR- <PERR- INTx-
        Interrupt: pin A routed to IRQ 9
        Kernel driver in use: piix4_smbus
        Kernel modules: i2c_piix4

00:02.0 VGA compatible controller: Cirrus Logic GD 5446 (prog-if 00 [VGA controller])
        Subsystem: Red Hat, Inc. QEMU Virtual Machine
        Physical Slot: 2
        Control: I/O+ Mem+ BusMaster- SpecCycle- MemWINV- VGASnoop- ParErr- Stepping- SERR- FastB2B- DisINTx-
        Status: Cap- 66MHz- UDF- FastB2B- ParErr- DEVSEL=fast >TAbort- <TAbort- <MAbort- >SERR- <PERR- INTx-
        Region 0: Memory at fc000000 (32-bit, prefetchable) [size=32M]
        Region 1: Memory at febf0000 (32-bit, non-prefetchable) [size=4K]
        Expansion ROM at febd0000 [disabled] [size=64K]
        Kernel driver in use: cirrus
        Kernel modules: cirrus

00:03.0 Ethernet controller: Red Hat, Inc. Virtio network device
        Subsystem: Red Hat, Inc. Device 0001
        Physical Slot: 3
        Control: I/O+ Mem+ BusMaster+ SpecCycle- MemWINV- VGASnoop- ParErr- Stepping- SERR- FastB2B- DisINTx+
        Status: Cap+ 66MHz- UDF- FastB2B- ParErr- DEVSEL=fast >TAbort- <TAbort- <MAbort- >SERR- <PERR- INTx-
        Latency: 0
        Interrupt: pin A routed to IRQ 10
        Region 0: I/O ports at c000 [size=64]
        Region 1: Memory at febf1000 (32-bit, non-prefetchable) [size=4K]
        Expansion ROM at febe0000 [disabled] [size=64K]
        Capabilities: [40] MSI-X: Enable+ Count=5 Masked-
                Vector table: BAR=1 offset=00000000
                PBA: BAR=1 offset=00000800
        Kernel driver in use: virtio-pci
        Kernel modules: virtio_pci

00:04.0 SCSI storage controller: Red Hat, Inc. Virtio block device
        Subsystem: Red Hat, Inc. Device 0002
        Physical Slot: 4
        Control: I/O+ Mem+ BusMaster+ SpecCycle- MemWINV- VGASnoop- ParErr- Stepping- SERR- FastB2B- DisINTx+
        Status: Cap+ 66MHz- UDF- FastB2B- ParErr- DEVSEL=fast >TAbort- <TAbort- <MAbort- >SERR- <PERR- INTx-
        Latency: 0
        Interrupt: pin A routed to IRQ 11
        Region 0: I/O ports at c040 [size=64]
        Region 1: Memory at febf2000 (32-bit, non-prefetchable) [size=4K]
        Capabilities: [40] MSI-X: Enable+ Count=2 Masked-
                Vector table: BAR=1 offset=00000000
                PBA: BAR=1 offset=00000800
        Kernel driver in use: virtio-pci
        Kernel modules: virtio_pci

00:05.0 Unclassified device [00ff]: Red Hat, Inc. Virtio memory balloon
        Subsystem: Red Hat, Inc. Device 0005
        Physical Slot: 5
        Control: I/O+ Mem+ BusMaster+ SpecCycle- MemWINV- VGASnoop- ParErr- Stepping- SERR- FastB2B- DisINTx-
        Status: Cap- 66MHz- UDF- FastB2B- ParErr- DEVSEL=fast >TAbort- <TAbort- <MAbort- >SERR- <PERR- INTx-
        Latency: 0
        Interrupt: pin A routed to IRQ 10
        Region 0: I/O ports at c0a0 [size=32]
        Kernel driver in use: virtio-pci
        Kernel modules: virtio_pci

# 这样写也行,但是没法判断具体是哪个设备的数值,建议使用第一种
$ lspci -vvv | grep "MSI-X: Enable+ "
        Capabilities: [40] MSI-X: Enable+ Count=5 Masked-
        Capabilities: [40] MSI-X: Enable+ Count=2 Masked-
查看网卡是否支持多队列
$ ethtool -l eth0
Channel parameters for eth0:
Pre-set maximums:
RX:             0
TX:             0
Other:          0
Combined:       2
Current hardware settings:
RX:             0
TX:             0
Other:          0
Combined:       2
设置队列数
$ ethtool -L eth0 combined 1
$ ethtool -l eth0
Channel parameters for eth0:
Pre-set maximums:
RX:             0
TX:             0
Other:          0
Combined:       2
Current hardware settings:
RX:             0
TX:             0
Other:          0
Combined:       1
irqbalance
$ systemctl status irqbalance
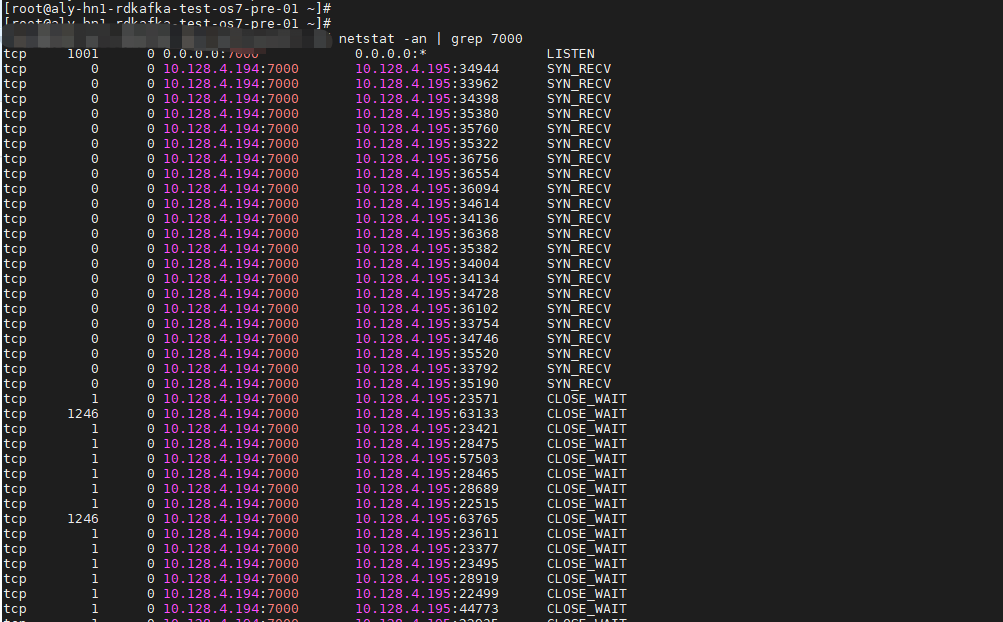
一次压测出现服务无响应,服务端端口出现五百多个CLOSE_WAIT,剩下的都是SYN_RECV
没有GC压力,但是老年代都是满的
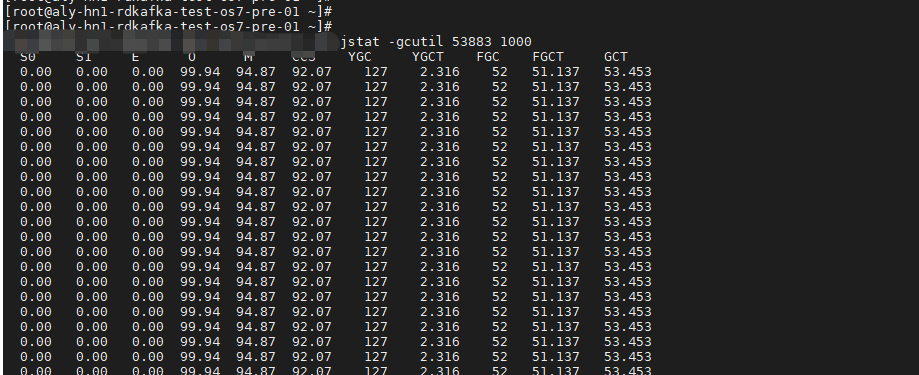
服务器是16G的,服务启动内存设置的512M,加大内存设置到4G,重启问题消失,执行观察中~
一次压测出现QPS越跑越低,但是并没有出现慢查询sql的现象
因为随着时间增长,数据库中的数据越来越多,userId是唯一的,脚本随机范围是9000w,时间久了之后新生成的userId是重复的,代码逻辑中执行的操作是update
update需要一个一个的执行,之前重复少的时候mysql操作主要是insert,而且是批量插入
后来update变多之后,mysql的压力就变大了,整体性能下降了