Openlayer4 - 最好最强大的开源地图引擎
# github
https://github.com/openlayers/openlayers

# 官网
http://openlayers.org/

# API
http://openlayers.org/en/latest/apidoc/index.html

# 中文教程
http://weilin.me/ol3-primer/
坐标可以在这里查询
# 百度接口
http://api.map.baidu.com/lbsapi/getpoint/index.html

# openlayer 实现的deom
http://openlayers.org/en/latest/examples/mouse-position.html
npm install ol --save
https://github.com/openlayers/openlayers/tree/master/package
一些非demo的收集和备注
# 加载地图时的进度条
http://openlayers.org/en/latest/examples/tile-load-events.html
demo 1 :
清注意,这个demo中的大部分API都会在后续频繁使用的
const ol = require('js/ol.js');
require('css/ol.css');

/**
  坐标可以在这里查询 :
  百度地图API : http://api.map.baidu.com/lbsapi/getpoint/index.html
  openlayer官方API : http://openlayers.org/en/latest/examples/mouse-position.html
*/

  var map = new ol.Map({
    layers: [
      new ol.layer.Tile({
        source: new ol.source.OSM()
      })
    ],
    target: 'map',
    view: new ol.View({
      projection: 'EPSG:4326',//'EPSG:3857',
      center: [105.4265, 34.7782],
      zoom: 5,
      minZoom:4,
      maxZoom:6
    })
  });
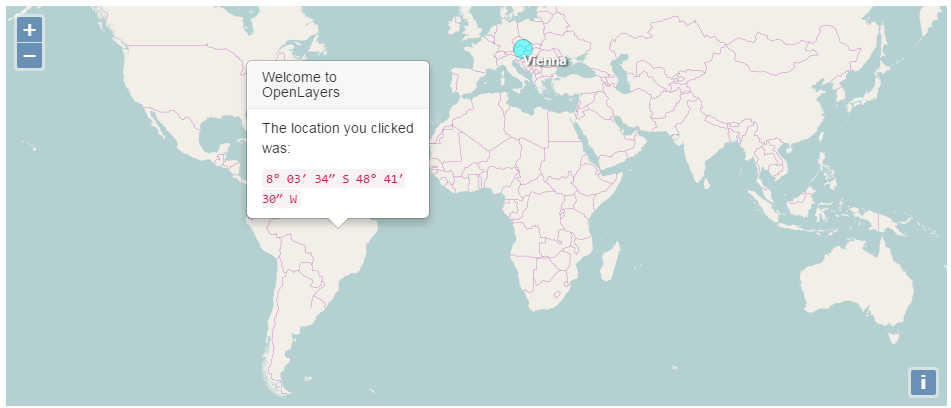
demo2 : 结合jquery + bootstrap实现点击气泡
http://openlayers.org/en/latest/examples/overlay.html
核心知识点:map.on绑定click事件、获取当前地理位置参数。


const ol = require('js/ol.js');
const $ = require("jquery"); if ( typeof window === "object") {window.jQuery = $;};
require("bootstrap");
require('css/ol.css');
require('css/Overlay.css');


var layer = new ol.layer.Tile({
        source: new ol.source.OSM()
});

var map = new ol.Map({
  layers: [layer],
  target: 'map',
  view: new ol.View({
    center: [0, 0],
    zoom: 2
  })
});

var pos = ol.proj.fromLonLat([16.3725, 48.208889]);

// Vienna marker
var marker = new ol.Overlay({
  position: pos,
  positioning: 'center-center',
  element: document.getElementById('marker'),
  stopEvent: false
});
map.addOverlay(marker);

// Vienna label
var vienna = new ol.Overlay({
  position: pos,
  element: document.getElementById('vienna')
});
map.addOverlay(vienna);

// Popup showing the position the user clicked
var popup = new ol.Overlay({
  element: document.getElementById('popup')
});
map.addOverlay(popup);

map.on('click', function(evt) {
  var element = popup.getElement();
  var coordinate = evt.coordinate;
  var hdms = ol.coordinate.toStringHDMS(ol.proj.transform(
      coordinate, 'EPSG:3857', 'EPSG:4326'));

  $(element).popover('destroy');
  popup.setPosition(coordinate);
  // the keys are quoted to prevent renaming in ADVANCED mode.
  $(element).popover({
    'placement': 'top',
    'animation': false,
    'html': true,
    'content': '<p>The location you clicked was:</p><code>' + hdms + '</code>'
  });
  $(element).popover('show');
});
demo3 : 设置边界线
const ol = require('js/ol.js');
require('css/ol.css');
   new ol.Map({
            layers: [
                new ol.layer.Tile({source: new ol.source.OSM()})
            ],
            view: new ol.View({
                // 设置地图中心范围
                extent: [102, 29, 104, 31],
                // 设置成都为地图中心
                center: [104.06, 30.67],
                projection: 'EPSG:4326',
                zoom: 10
            }),
            target: 'map'
      });
demo 4 :绘制线条
<script src="https://api.mapbox.com/mapbox.js/plugins/arc.js/v0.1.0/arc.js"></script>
实现该效果需要第三方插件的支持

html:
<!doctype html>
<html lang="en">
  <head>
    <title>OpenLayers</title>
    <style type="text/css">
      #map {
        width:100%;
        height:100vh;
      }
    </style>
  </head>
  <body>
     <div id="map" class="map"></div>
     <script src="https://api.mapbox.com/mapbox.js/plugins/arc.js/v0.1.0/arc.js"></script>
  </body>
</html>
js:
const ol = require('js/ol.js');
require('css/ol.css');

  var map = new ol.Map({
        layers: [
          new ol.layer.Tile({
            source: new ol.source.Stamen({
              layer: 'toner'
            })
          })
        ],
        target: 'map',
        view: new ol.View({
          center: [0, 0],
          zoom: 2
        })
  });

  var style = new ol.style.Style({
    stroke: new ol.style.Stroke({
      color: '#EAE911',
       2
    })
  });

  var flightsSource;
  var addLater = function(feature, timeout) {
    window.setTimeout(function() {
      feature.set('start', new Date().getTime());
      flightsSource.addFeature(feature);
    }, timeout);
  };

  var pointsPerMs = 0.1;
  var animateFlights = function(event) {
    var vectorContext = event.vectorContext;
    var frameState = event.frameState;
    vectorContext.setStyle(style);

    var features = flightsSource.getFeatures();
    for (var i = 0; i < features.length; i++) {
      var feature = features[i];
      if (!feature.get('finished')) {
        // only draw the lines for which the animation has not finished yet
        var coords = feature.getGeometry().getCoordinates();
        var elapsedTime = frameState.time - feature.get('start');
        var elapsedPoints = elapsedTime * pointsPerMs;

        if (elapsedPoints >= coords.length) {
          feature.set('finished', true);
        }

        var maxIndex = Math.min(elapsedPoints, coords.length);
        var currentLine = new ol.geom.LineString(coords.slice(0, maxIndex));

        // directly draw the line with the vector context
        vectorContext.drawGeometry(currentLine);
      }
    }
    // tell OpenLayers to continue the animation
    map.render();
  };


  flightsSource = new ol.source.Vector({
    wrapX: false,
    attributions: 'Flight data by ' +
          '<a href="http://openflights.org/data.html">OpenFlights</a>,',
    loader: function() {
      var url = 'https://openlayers.org/en/v4.0.1/examples/data/openflights/flights.json';
      fetch(url).then(function(response) {
        return response.json();
      }).then(function(json) {
        var flightsData = json.flights;
        for (var i = 0; i < flightsData.length; i++) {
          var flight = flightsData[i];
          var from = flight[0];
          var to = flight[1];

          // create an arc circle between the two locations
          var arcGenerator = new arc.GreatCircle(
              {x: from[1], y: from[0]},
              {x: to[1], y: to[0]}
          );

          // 绘制的速度
          var arcLine = arcGenerator.Arc(1000, {offset: 10});
          if (arcLine.geometries.length === 1) {
            var line = new ol.geom.LineString(arcLine.geometries[0].coords);
            line.transform(ol.proj.get('EPSG:4326'), ol.proj.get('EPSG:3857'));

            var feature = new ol.Feature({
              geometry: line,
              finished: false
            });
            addLater(feature, i * 50);
          }
        }
        map.on('postcompose', animateFlights);
      });
    }
  });

  var flightsLayer = new ol.layer.Vector({
    source: flightsSource,
    style: function(feature) {
      // if the animation is still active for a feature, do not
      // render the feature with the layer style
      if (feature.get('finished')) {
        return style;
      } else {
        return null;
      }
    }
  });
  map.addLayer(flightsLayer);
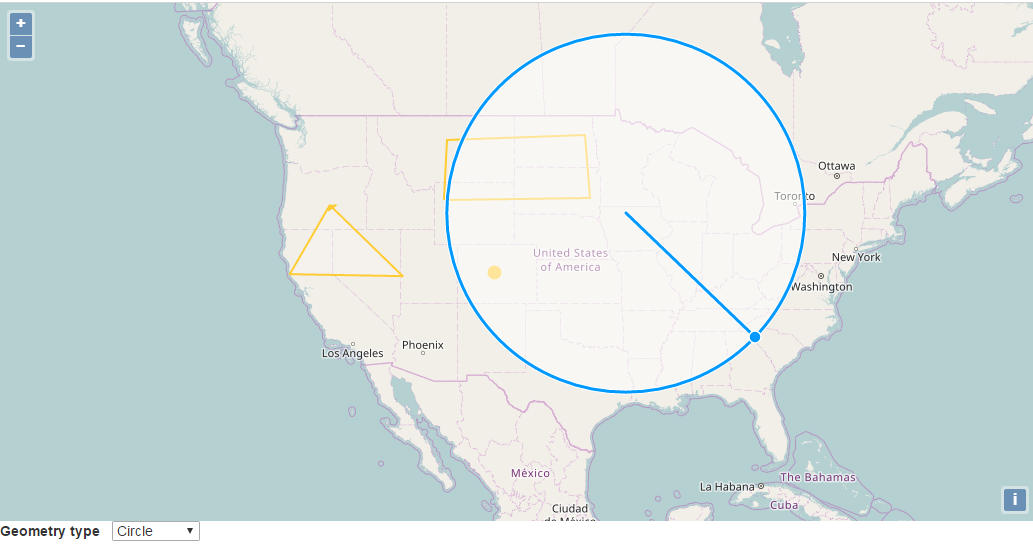
demo5 : 多方式标记地图
http://openlayers.org/en/latest/examples/draw-and-modify-features.html
html:
<!doctype html> <html lang="en"> <head> <title>OpenLayers</title> </head> <body> <div id="map" class="map"></div> <form class="form-inline"> <label>Geometry type </label> <select id="type"> <option value="Point">Point</option> <option value="LineString">LineString</option> <option value="Polygon">Polygon</option> <option value="Circle">Circle</option> </select> </form> <script src="https://api.mapbox.com/mapbox.js/plugins/arc.js/v0.1.0/arc.js"></script> </body> </html>
js:
const ol = require('js/ol.js');
const $ = require("jquery"); if ( typeof window === "object") {window.jQuery = $;};
require("bootstrap");
require('css/ol.css');
require('css/Overlay.css');
 var raster = new ol.layer.Tile({
        source: new ol.source.OSM()
      });

      var map = new ol.Map({
        layers: [raster],
        target: 'map',
        view: new ol.View({
          center: [-11000000, 4600000],
          zoom: 4
        })
      });

      var features = new ol.Collection();
      var featureOverlay = new ol.layer.Vector({
        source: new ol.source.Vector({features: features}),
        style: new ol.style.Style({
          fill: new ol.style.Fill({
            color: 'rgba(255, 255, 255, 0.2)'
          }),
          stroke: new ol.style.Stroke({
            color: '#ffcc33',
             2
          }),
          image: new ol.style.Circle({
            radius: 7,
            fill: new ol.style.Fill({
              color: '#ffcc33'
            })
          })
        })
      });
      featureOverlay.setMap(map);

      var modify = new ol.interaction.Modify({
        features: features,
        // the SHIFT key must be pressed to delete vertices, so
        // that new vertices can be drawn at the same position
        // of existing vertices
        deleteCondition: function(event) {
          return ol.events.condition.shiftKeyOnly(event) &&
              ol.events.condition.singleClick(event);
        }
      });
      map.addInteraction(modify);

      var draw; // global so we can remove it later
      var typeSelect = document.getElementById('type');

      function addInteraction() {
        draw = new ol.interaction.Draw({
          features: features,
          type: /** @type {ol.geom.GeometryType} */ (typeSelect.value)
        });
        map.addInteraction(draw);
      }


      /**
       * Handle change event.
       */
      typeSelect.onchange = function() {
        map.removeInteraction(draw);
        addInteraction();
      };

      addInteraction();
demo6 : 覆盖标记
http://openlayers.org/en/latest/examples/image-vector-layer.html

html:
<!doctype html> <html lang="en"> <head> <title>OpenLayers</title> </head> <body> <div id="map" class="map"></div> <div id="info"> </div> <script src="https://api.mapbox.com/mapbox.js/plugins/arc.js/v0.1.0/arc.js"></script> </body> </html>
js:
const ol = require('js/ol.js');
const $ = require("jquery"); if ( typeof window === "object") {window.jQuery = $;};
require("bootstrap");
require('css/ol.css');
require('css/Overlay.css');


 var map = new ol.Map({
        layers: [
          new ol.layer.Tile({
            source: new ol.source.OSM()
          }),
          new ol.layer.Image({
            source: new ol.source.ImageVector({
              source: new ol.source.Vector({
                url: 'https://openlayers.org/en/v4.0.1/examples/data/geojson/countries.geojson',
                format: new ol.format.GeoJSON()
              }),
              style: new ol.style.Style({
                fill: new ol.style.Fill({
                  color: 'rgba(255, 255, 255, 0.6)'
                }),
                stroke: new ol.style.Stroke({
                  color: '#319FD3',
                   1
                })
              })
            })
          })
        ],
        target: 'map',
        view: new ol.View({
          center: [0, 0],
          zoom: 4
        })
      });

      var featureOverlay = new ol.layer.Vector({
        source: new ol.source.Vector(),
        map: map,
        style: new ol.style.Style({
          stroke: new ol.style.Stroke({
            color: '#f00',
             1
          }),
          fill: new ol.style.Fill({
            color: 'rgba(255,0,0,0.1)'
          })
        })
      });

      var highlight;
      var displayFeatureInfo = function(pixel) {

        var feature = map.forEachFeatureAtPixel(pixel, function(feature) {
          return feature;
        });

        var info = document.getElementById('info');
        if (feature) {
          info.innerHTML = feature.getId() + ': ' + feature.get('name');
        } else {
          info.innerHTML = ' ';
        }

        if (feature !== highlight) {
          if (highlight) {
            featureOverlay.getSource().removeFeature(highlight);
          }
          if (feature) {
            featureOverlay.getSource().addFeature(feature);
          }
          highlight = feature;
        }

      };

      map.on('pointermove', function(evt) {
        if (evt.dragging) {
          return;
        }
        var pixel = map.getEventPixel(evt.originalEvent);
        displayFeatureInfo(pixel);
      });

      map.on('click', function(evt) {
        displayFeatureInfo(evt.pixel);
      });
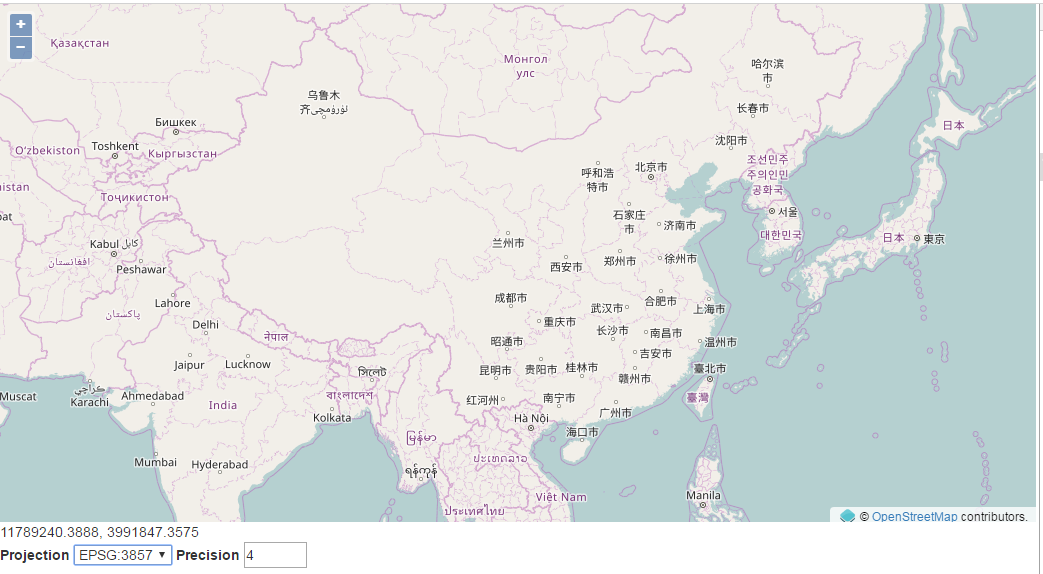
demo 7 : Mouse Position
http://openlayers.org/en/latest/examples/mouse-position.html
清注意,center参数中用到的数组正是 EPSG:3857 的值
html:
<!doctype html>
<html lang="en">
  <head>
    <title>OpenLayers</title>
  </head>
  <body>
     <div id="map" class="map"></div>
      <div id="mouse-position"></div>
    <form>
      <label>Projection </label>
      <select id="projection">
        <option value="EPSG:4326">EPSG:4326</option>
        <option value="EPSG:3857">EPSG:3857</option>
      </select>
      <label>Precision </label>
      <input id="precision" type="number" min="0" max="12" value="4"/>
    </form>
  </body>
</html>
js :
const ol = require('js/ol.js');
const $ = require("jquery"); if ( typeof window === "object") {window.jQuery = $;};
require("bootstrap");
require('css/ol.css');
require('css/Overlay.css');


  var mousePositionControl = new ol.control.MousePosition({
    coordinateFormat: ol.coordinate.createStringXY(4),
    projection: 'EPSG:4326',
    // comment the following two lines to have the mouse position
    // be placed within the map.
    className: 'custom-mouse-position',
    target: document.getElementById('mouse-position'),
    undefinedHTML: ' '
  });

  var map = new ol.Map({
    controls: ol.control.defaults({
      attributionOptions: /** @type {olx.control.AttributionOptions} */ ({
        collapsible: false
      })
    }).extend([mousePositionControl]),
    layers: [
      new ol.layer.Tile({
        source: new ol.source.OSM()
      })
    ],
    target: 'map',
    view: new ol.View({
      center: [0, 0],
      zoom: 2
    })
  });

  var projectionSelect = document.getElementById('projection');
  projectionSelect.addEventListener('change', function(event) {
    mousePositionControl.setProjection(ol.proj.get(event.target.value));
  });

  var precisionInput = document.getElementById('precision');
  precisionInput.addEventListener('change', function(event) {
    var format = ol.coordinate.createStringXY(event.target.valueAsNumber);
    mousePositionControl.setCoordinateFormat(format);
  });