封装构造函数,用canvas写饼状图和柱状图
封装函数
// 场景
function XDLScence( options ) {
    this.stage = options.stage;
    //执行场景的初始化
    this.init = options.init || XDLScence.voidFn;
    //执行场景的进场动画
    this.pre = options.pre || XDLScence.voidFn;
    //执行场景的出场动画
    this.post = options.post || XDLScence.voidFn;

    this.layers = options.layers || [new Konva.Layer()];
    this.name = options.name || '';
    this.init();
}

XDLScence.prototype = {
	constructor: XDLScence,
	voidFn: function() {},
	CurrentScence: null,
	//场景要进入舞台,只需要调用场景的 play方法。
	play: function () {
        var _this = this;
                // doPre,
	    var doPre = function doPre() {
            // stage.add(_this.layer);// 把当前层添加到舞台
            _this.layers.forEach(function( val ){
                _this.stage.add( val );
            });
            XDLScence.currentScene = _this;
            _this.pre();
        };

        //如果不是第一个场景,先执行当前场景的出场动画,然后执行下一个场景的入场动画
        //需要在场景的post方法中执行传进去的 next 方法。
        if (XDLScence.currentScene) {
            //执行上一个场景的出场动画
            XDLScence.currentScene.post(doPre);
        } else {
            //如果是第一个场景直接执行入场动画
            doPre();
        }
    }// play
};


//=============>S=============柱状图数据demo
// var data = [{
	// 	name: '百度', value: .2, color: 'lightgreen'
	// },{
	// 	name: '阿里', value: .4, color: 'lightgreen'
	// },{
	// 	name: '新浪', value: .1, color: 'lightgreen'
	// },{
	// 	name: '搜狐', value: .1, color: 'lightgreen'
	// },{
	// 	name: '360', value: .2, color: 'lightgreen'
	// }];

//柱状图构造函数
function Histogram(option) {
	this.group = new Konva.Group({
		x: option.x,
		y: option.y
	});
	this.init(option);
}

//柱状图的原型对象
Histogram.prototype = {
	constructor: Histogram,
	init: function( option ) {
		option.data = option.data || [];
		//底线的宽度
		option.blWidth = option.blWidth || 2;
		option.blColor = option.blColor || 'lightgreen';
		option.width = option.width || 200;
		option.height = option.height || 200;
		option.fontSize =  option.fontSize || 12;

		//把最高的柱状图的高度换算成 柱状图要求的高度。
		var maxValue = 0;
		for(var i = 0; i < option.data.length; i++ ) {
		 	maxValue = maxValue > option.data[i].value ? maxValue : option.data[i].value;
		}
		option.height = option.height / maxValue;

		//创建底线
		var bottomLine = new Konva.Line({
			strokeWidth: option.blWidth,
			stroke: option.blColor,
			points: [ 0, 0, option.width, 0 ],
			lineCap: 'round',
		    lineJoin: 'round'
		});
		this.group.add( bottomLine );

		//rectWidth
		var rectAllWidth = option.width / option.data.length;
		for(var i = 0; i < option.data.length; i++ ) {
			var tempData = option.data[i];
			//创建每个柱状图
			var rect = new Konva.Rect({
				x: rectAllWidth * (1/4 + i),
				y: -1 * (option.height * tempData.value) - 1/2*option.blWidth,
				 1/2 * rectAllWidth,
				height: option.height * tempData.value,
				fill: tempData.color,
				shadowBlur: 5,
				shadowColor: tempData.color,
				// shadowOffset: {x : 10, y : 10},
				shadowOpacity: 0.5,
				opacity: .5,
				name: 'histogramRect',
				cornerRadius: 5
			});

			//创建 柱状图百分比文本
			var text = new Konva.Text({
				x: rectAllWidth *  i,
				y: -1 * (option.height * tempData.value) - 1/2*option.blWidth - option.fontSize -3,
				fontSize: option.fontSize,
				fill: tempData.color,
				fontFamily: '微软雅黑',
				text: tempData.value * 100  + '%',
				name: 'txt',
				 rectAllWidth,
				align: 'center'
			});

			//创建 柱状图名字文本
			var nameText = new Konva.Text({
				x: rectAllWidth * (1/2 + i),
				y: option.blWidth + 3,
				fontSize: option.fontSize,
				fill: tempData.color,
				fontFamily: '微软雅黑',
				text: tempData.name,
				rotation: 30
			});

			this.group.add( rect );
			this.group.add( text );
			this.group.add( nameText );
		}

	},
	playAnimate: function() {
		this.group.to({
			duration: .1,
			opacity: 1
		});

		this.group.find('.histogramRect').each(function( value, index ) {
			var oldY = value.y();
			var oldHeight = value.height();
			value.y(0);
			value.height(0);

			value.to({
				duration: .8,
				y: oldY,
				height: oldHeight,
				opacity: .9
			});
		});


		this.group.find(".txt").each(function(val){
			var oldY = val.y();
			val.y(0);
			val.opacity(.1);
			val.to({
				duration: .8,
				y: oldY,
				opacity: 1
			});
		});
	},
	addToGroupOrLayer: function( group ) {
		group.add(this.group);
	}
};
/*
	使用案例dmeo:
	var data = [{
			name: '阿里', value: .2, color: 'lightgreen'
		},{
			name: '百度', value: .4, color: 'red'
		},{
			name: '新浪', value: .1, color: 'blue'
		},{
			name: '盛大', value: .1, color: '#8E8E38'
		},{
			name: '360', value: .2, color: 'purple'
		}];

	var his = new Histogram({
		data: data,
		x: 1/8 * stage.width(),
		y: 3/4 * stage.height(),
		blWidth: 2,
		blColor: 'lightblue',
		 3/4 * stage.width(),
		height: 1 * stage.height(),
		fontSize: 14
	});
	his.addToGroupOrLayer(layer);
	layer.draw();
	his.playAnimate();

	layer.on('click',function(){
		his.playAnimate();
	});
*/

//=============>E 柱状图=============


//=============>S  进度条=============

function ProgressBar(option) {
	this.group = new Konva.Group({
		x: option.x,
		y: option.y
	});
	this.maxWidth = option.width;

	this.drawLayer = null;

	this.init(option);
}

ProgressBar.prototype = {
	constructor: ProgressBar,
	init: function( option ) {
		var innerRect = new Konva.Rect({
			x: 0,
			y: 0,
			 0,
			height: option.height,
			fill: option.fillColor,
			name: 'innerRect',
			cornerRadius: 1/2 * option.height
		});
		this.group.add( innerRect );

		var outerRect = new Konva.Rect({
			x: 0,
			y: 0,
			 option.width,
			height: option.height,
			strokeWidth: option.strokeWidth,
			stroke: option.strokeColor,
			name: 'outerRect',
			cornerRadius: 1/2 * option.height
		});
		this.group.add( outerRect );

		var drawText = new Konva.Text({
			text: '努力加载中:0%',
			x: this.maxWidth / 2 - 14 * 3,
			y: -outerRect.height(),
			fontSize: 14,
			fontStyle: 'bold',
			fontFamily: '微软雅黑',
			align: 'center',
			name: 'txt'
		});
		this.group.add( drawText );
	},

	addToLayerOrGroup: function( layer ) {
		layer.add( this.group );
		this.drawLayer = layer;
	},

	changeValue: function( val ) {
		if(val > 1) {
			val /= 100;
		}
		var rect = this.group.findOne(".innerRect");
		// rect.width(this.maxWidth * val);
		rect.to({
			duration: .2,
			 this.maxWidth * val
		});

		var txt = this.group.findOne('.txt');
		txt.text( '努力加载中:' + Number(val).toFixed(2) * 100 + '%');

		this.drawLayer.batchDraw();
	},
	pre: function() {
		var tween = new Konva.Tween({
			node: this.group,
			// scaleX: 1.2,
			// scaleY: 1.2,
			duration: .5,
			opacity: .8,
			onFinish: function() {
			}
		});
		tween.play();
	}
};
/*
	使用方法:

	var bgLayer = new Konva.Layer();
	var progressBar = new ProgressBar({
		x: stage.width() / 8,
		y: stage.height() / 2,
		 stage.width() * 3/4,
		height: stage.height() / 20,
		fillColor: '#cdcd00',
		strokeColor: '#e0ffff',
		strokeWidth: 6
	});
	progressBar.addToLayerOrGroup(bgLayer);
	stage.add(bgLayer);
	bgLayer.batchDraw();

	progressBar.changeValue(.56);


*/
//=============>E  进度条=============


//=============>S  加载动画=============
function LoadingAnimate( option ) {
	this.loadingGroup = null;
	this.circleArr = [];

	//初始化动画组件
	this.init( option );
}

LoadingAnimate.prototype = {
	constructor: LoadingAnimate,
	init: function( option ) {
		option.radius = option.radius || 30;
		option.cenX = option.cenX;
		option.cenY = option.cenY;
		option.colors = option.colors || ["orange", "lightgreen", "lightblue"];
		option.duration = option.duration || 1;
		option.opactiy = option.opacity || .6;
		option.scaleRange =  option.scaleRange || .2;

		this.loadingGroup =	new Konva.Group({
			x: option.cenX,
			y: option.cenY
		});

		// var colors = ["orange", "lightgreen", "lightblue"];
		for( var i = 0; i < 3; i++ ) {
			var tempCircle = new Konva.Circle({
				x: ( i-1 ) * option.radius * 2,
				y: 0,
				fill: colors[i],
				radius: option.radius
			});
			this.loadingGroup.add(tempCircle);
			this.circleArr[i] = tempCircle;
		}

	},
	//把动画加载到层中
	addToLayerOrGroup: function( layer ) {
		layer.add( this.loadingGroup );
	},
	//开始动画
	playAnimate: function() {
		var c1 = this.circleArr[0];
		var c3 = this.circleArr[2];
		var _this = this;

		c1.setZIndex(2);
		c3.setZIndex(0);
		c1.to({
			duration: .8,
			x: 2 * c1.radius(),
			y: 0,
			opacity: .8,
			scaleY: 1.2,
			scaleX: 1.2,
			onFinish : function() {
				c1.setZIndex(0);
				c1.to({
					duration: .8,
					x: - 2 * c1.radius(),
					y: 0,
					opacity: .8,
					scaleY: 1,
					scaleX: 1,
				});
			}
		});

		c3.to({
			duration: .8,
			x: - 2 * c3.radius(),
			y: 0,
			opacity: .8,
			scaleY: .8,
			scaleX: .8,
			onFinish : function() {
				c3.setZIndex(2);
				c3.to({
					duration: .8,
					x: 2 * c3.radius(),
					y: 0,
					opacity: .8,
					scaleY: 1,
					scaleX: 1,
					onFinish: function() {
						_this.playAnimate();
					}
				});
			}
		});
	}
};

/*
	使用方法:
	var loadingDemo2 = new LoadingAnimate({
		radius: 40,
		cenX: 100,
		cenY: 300,
		colors: ["orange", "lightgreen", "lightblue"],
		duration: 1,
		opacity: .8,
		scaleRange: .3
	});

	loadingDemo2.addToLayerOrGroup(layer);
	loadingDemo2.playAnimate();
*/

//=============>E  加载动画=============

//=============>S  饼状图=============
function PieChart(option) {
	var _this = this;
	if( !option ) {
		throw new Error('请初始化饼状图的参数');
	}
	this.animageIndex = 0;
	this.playAnimateCallee = null;
	this.group = null;
	this.txtGroup = null;
	this.animateDuration = .8;
	this.outerCircle = null;
	this.data  = null;
	this.init(option);//初始化
}

PieChart.prototype = {
	constructor: PieChart,
	init: function(option) {
		//饼状图数据:[{name:'',value:.2,color:'red'},...]
		option.data = option.data || [];

		//动画执行的时间
		option.animateDuration = option.animateDuration || .8;
		this.animateDuration = option.animateDuration;
		//动画执行的效果
		option.easing = option.easing || Konva.Easings.Linear;
		//x,y坐标
		option.x = option.x || 0;
		option.y = option.y || 0;
		//饼状图半径
		option.radius = option.radius === 0 ? 0 : option.radius || 100;

		option.txtAwayFromWedge = option.txtAwayFromWedge || 20;

		this.data = option.data;
		//扇区的组
		this.group = new Konva.Group({
			x: option.x,
			y: option.y
		});

		//文字的组
		this.txtGroup = new Konva.Group({
			x: option.x,
			y: option.y
		});

		//默认的旋转角度
		var tempAngel = -90;
		//遍历生成所有扇形的对象
		for(var i = 0; i < option.data.length; i++ ) {
			var wedgeAngel = option.data[i].value * 360;
			var wedge = new Konva.Wedge({
				x: 0,
				y: 0,
				radius: option.radius,
				fill: option.data[i].color,
				angle: 0,//后面有计算出角度放到数组中
				opacity: .6,
				id: option.data[i].name,
				name: wedgeAngel + '',
				rotation: tempAngel,
				visible: true
			});
			this.group.add(wedge);

			//当前 扇形的对象 和扇形的需要旋转的角度
			// arr.push({value: wedge, angle: option.data[i].value * 360});

			//绘制 文字
			//扇形区域的中间
			var rotationAngle = 0;
			var totalAngle = tempAngel + 1/2 * wedgeAngel;
			//设置文字的x坐标
			var txtX = Math.cos( totalAngle * Math.PI / 180) * (option.radius + option.txtAwayFromWedge);
			// 设置文字的y坐标
			var txtY = Math.sin( totalAngle * Math.PI / 180) * (option.radius + option.txtAwayFromWedge);
			var txtTitle = option.data[i].name +' ' + option.data[i].value * 100 + '%';
			var txt = new Konva.Text({
				x: txtX,
				y: txtY,
				fill: option.data[i].color,
				fontSize: '16px',
				fontFamily: '微软雅黑',
				fontStyle: 'bold',
				align: 'left',
				id: 'txt_' + option.data[i].name,
				text: txtTitle,
				rotation: rotationAngle,
				visible: false //默认隐藏
			});

			this.txtGroup.add(txt);

			//下面这段代码是根据 文字的位置设置一下文字的距离原型的位置
			if( totalAngle > 90 && totalAngle < 270 ) {
				// rotationAngle = -30;
				txt.x( txt.x()-txt.getWidth() );
			}

			//设置下一个元素旋转到具体的位置
			tempAngel += option.data[i].value * 360;
		}

		// 绘制外圆
		this.outerCircle = new Konva.Circle({
			stroke: '#a0a0a0',
			strokeWidth: 1,
			radius: option.radius + 5,
			x: option.x,
			y: option.y
		});


	},
	//展示动画
	playAnimate: function() {
		_this = this;
		if(this.animageIndex >= this.data.length) {
			_this.animageIndex = 0;
			return;
		}

		//先初始化到0的状态,然后进行绘制。
		if(this.animageIndex == 0) {
			_this.group.getChildren().each(function(value, index){
				value.angle(0);
			});
			_this.txtGroup.getChildren().each(function(value,index){
				value.hide();
			});
		}
		this.playAnimateCallee= arguments.callee;//当前函数

		//绘制一个 扇区的动画
		var wedge = this.group.getChildren()[this.animageIndex];
		var angel = Number(wedge.name());//扇区的度数
		wedge.to({
			angle: angel,
			duration: angel * this.animateDuration / 360,
			onFinish: function() {
				_this.txtGroup.getChildren()[_this.animageIndex].show();
				_this.txtGroup.getParent().draw();
				_this.animageIndex++;
				_this.playAnimateCallee();//调用当前函数自身,形成动画队列。
			}
		});
	},
	//把当前 饼状图添加到 层
	addToLayer: function(layer) {
		layer.add(this.group);
		layer.add(this.txtGroup);
		layer.add(this.outerCircle);
		layer.draw();
	},
};

/*
	用法:
	//饼状图数据
		var data = [{
						name: "前端",
						value: .25,
						color: 'lightblue'
					},{
						name: "php",
						value: .2,
						color: 'orange'
					},{
						name: "UI",
						value: .3,
						color: 'blue'
					},{
						name: "C++",
						value: .05,
						color: 'green'
					},{
						name: "游戏",
						value: .1,
						color: 'purple'
					},{
						name: "Java",
						value: .1,
						color: 'red'
					}];

		//创建饼状图
		var pieChart = new PieChart({
			data: data,//扇形区域的数据
			animateDuration: 2,//扇形动画的时间
			easing: Konva.Easings.EaseIn,//扇形动画的速度规格
			x: cenX,
			y: cenY,
			radius: .14 * stage.width(),//半径
			txtAwayFromWedge: .2 * .14 * stage.width()//扇形上的文字的距离圆形的距离
		});
		pieChart.addToLayer(layer);
		pieChart.playAnimate();
		layer.draw();

		layer.on('click tap', function(){
			pieChart.playAnimate();
		});
*/


//=============E  饼状图=============
饼状图

<!DOCTYPE html>
<html lang="en">
<head>
	<meta charset="UTF-8">
	<meta name="viewport" content="width=device-width, initial-scale=1.0, user-scalable=no">
	<title>饼状图</title>
	<style>
		body {
			padding: 0;
			margin: 0;
			background-color: #f0f0f0;
			overflow: hidden;
		}
	</style>
	<script src="./konva.js"></script>
	<script src="./KonvaExtend.js"></script>
</head>
<body>
	<div id="container">
	</div>

	<script>
		//创建舞台
		var stage = new Konva.Stage({
			container: 'container',
			 window.innerWidth,//全屏
			height: window.innerHeight
		});

		//创建层
		var layer = new Konva.Layer();
		stage.add(layer);

		//中心点坐标
		var cenX = stage.width() / 2;
		var cenY = stage.height() / 2;

		//创建加载层动画
		//饼状图数据
		var data = data = [
			{name:"apple", value:0.24, color:"pink"},
			{name:"三星", value:0.26, color:"skyblue"},
			{name:"华为", value:0.13, color:"orange"},
			{name:"锤子", value:0.17, color:"#333"},
			{name:"小米", value:0.08, color:"purple"},
			{name:"其他", value:0.12, color:"cyan"}
		];

		//创建饼状图
		var maxSize  = stage.width() > stage.height() ? stage.height() : stage.width();
		var pieChart = new PieChart({
			data: data,//扇形区域的数据
			animateDuration: 2,//扇形动画的时间
			easing: Konva.Easings.EaseIn,//扇形动画的速度规格
			x: cenX,
			y: cenY,
			radius: .3 * maxSize,//半径
			txtAwayFromWedge: .3 * .3 * maxSize//扇形上的文字的距离圆形的距离
		});
		pieChart.addToLayer(layer);
		pieChart.playAnimate();
		layer.draw();

		layer.on('click tap', function(){
			pieChart.playAnimate();
		});


	</script>
</body>
</html>
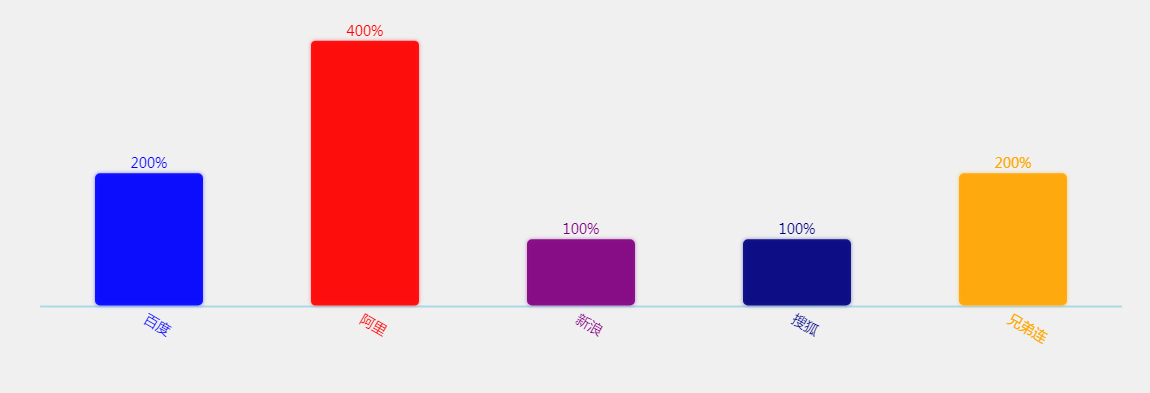
柱状图
<!DOCTYPE html>
<html lang="zh-CN">
<head>
	<meta charset="UTF-8">
	<meta name="viewport" content="width=device-width, initial-scale=1.0, user-scalable=no">
	<title>柱状图</title>
	<style>
		body {
			padding: 0;
			margin: 0;
			background-color: #f0f0f0;
			overflow: hidden;
		}
	</style>
	<script src="./konva.js"></script>
	<script src="./KonvaExtend.js" charset="utf-8"></script>
</head>
<body>
	<div id="container">
	</div>

	<script>
		var stage = new Konva.Stage({
			container: 'container',
			 window.innerWidth,
			height: window.innerHeight
		});


		var layer = new Konva.Layer();
		stage.add(layer);

		var cenX = stage.width() / 2;
		var cenY = stage.height() / 2;

		var data = [
			{ name: '百度', value: 2, color: 'blue' },
			{ name: '阿里', value: 4, color: 'red' },
			{ name: '新浪', value: 1, color: 'purple' },
			{ name: '搜狐', value: 1, color: 'navy' },
			{ name: '兄弟连', value: 2, color: 'orange'  }
		];

		var his = new Histogram({
			data: data,
			x: 1/8 * stage.width(),
			y: 3/4 * stage.height(),
			blWidth: 2,
			blColor: 'lightblue',
			 3/4 * stage.width(),
			height: 1/3 * stage.height(),
			fontSize: 14
		});
		his.addToGroupOrLayer(layer);
		layer.draw();
		his.playAnimate();

		layer.on('click',function(){
			his.playAnimate();
		});
	</script>
</body>
</html>