导读
如果想在一个页面里实例化带分类筛选的多个Echarts该怎么做呢?
曾探讨了带分类选择的关系图显示为自定义图片的需求实现,传送门ECharts图表插件(4.x版本)使用(一、关系图force节点显示为自定义图像/图片,带分类选择)
本篇将着重介绍如何根据后台返回的列表数据,实例化多个Echarts,对应所用技术点:Asp.Net MVC & Razor 视图引擎
最终产品效果图
产品需求几经变化,由加载全部图表到默认只展示一个图表,再到节点展示改为图像等;
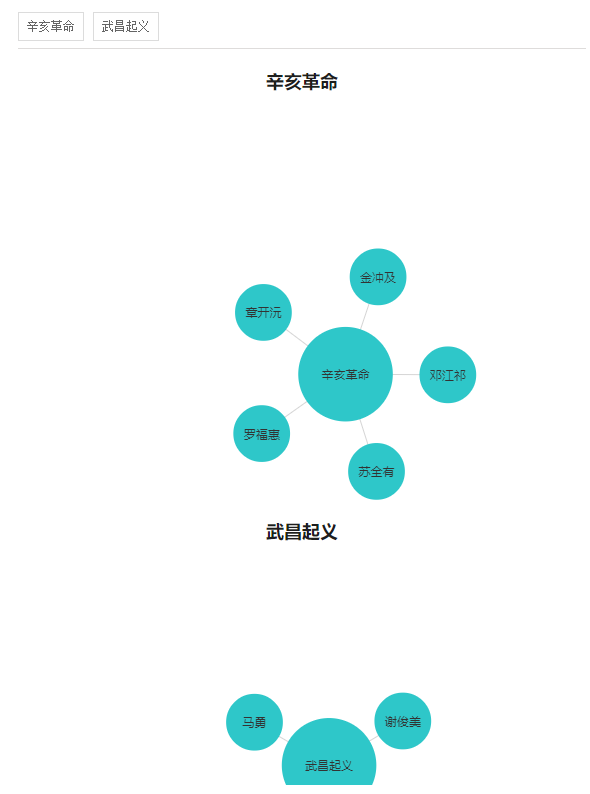
加载全部图表,多个ECharts
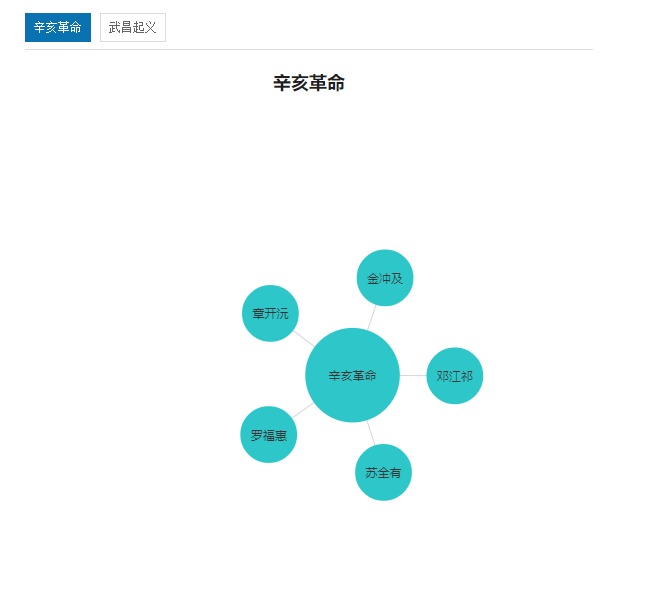
默认只展示一个图表,有分类筛选功能
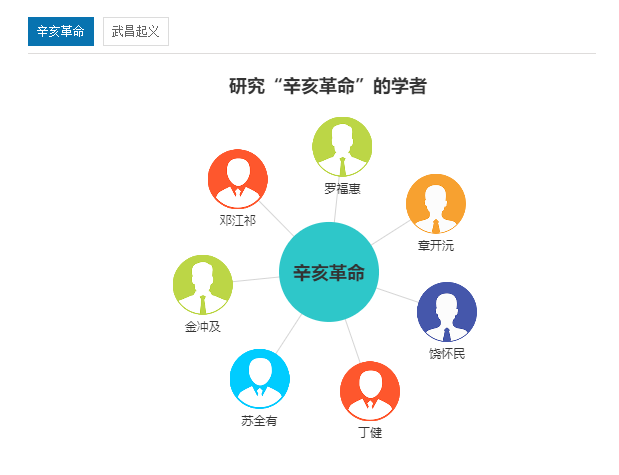
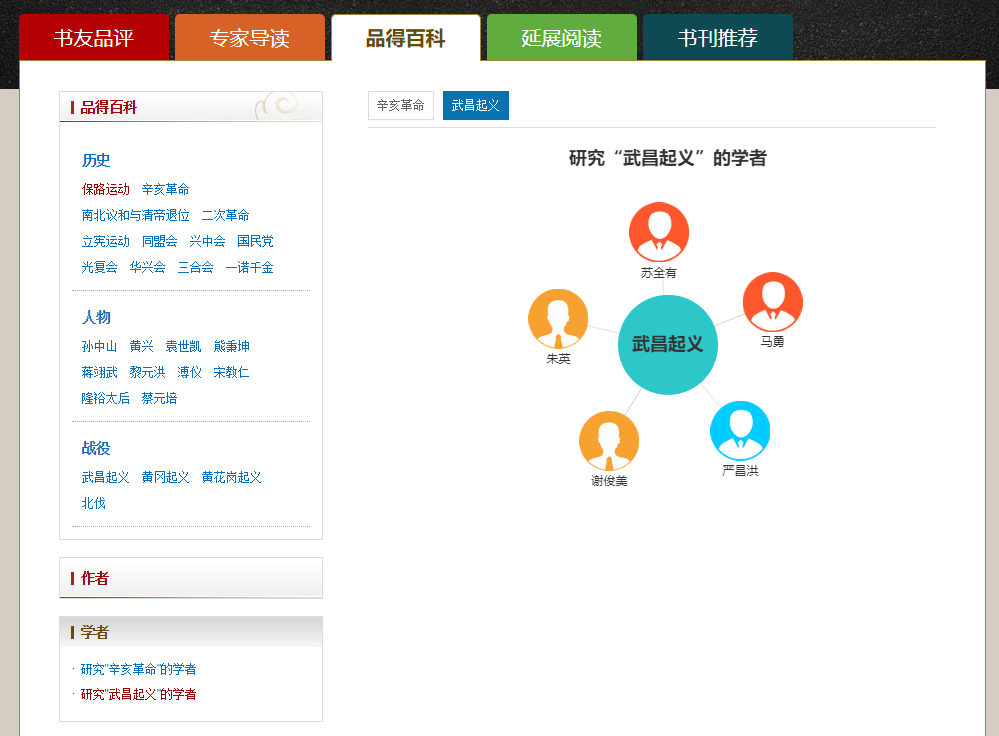
默认只展示一个图表,节点展示改为图像,有分类筛选功能
实现思路
带有筛选功能展示不同Echarts图表,而不是一个ECharts图表里的筛选功能,此需求实现,采用一次性实例化多个ECharts,隐藏掉其余实例,而不是切换分类时请求数据,进行实例化。
后台返回数据在razor视图模板里接收
@{
    Layout = "~/Views/Shared/_xkLayout.cshtml";

    List<xk_group> listGroup = ViewBag.Group;
    List<ScholarDto> list = ViewBag.List;
    List<IGrouping<long?, ScholarDto>> listGrouping = ViewBag.Grouping;
}
html代码,含c#语法
  <div class="rc left" id="ResultData">
            <!--学者-->
            <div class="scholar">

                <div class="choose clearfix">
                    @if (listGrouping != null && listGrouping.Count > 0)
                    {
                        foreach (var item in listGrouping)
                        {
                    <a href="javascript:;" data-groupid="@item.Key" data-groupname="@item.FirstOrDefault().GroupName">@item.FirstOrDefault().GroupName</a>
                        }
                    }
                </div>
                @if (listGroup != null && listGroup.Count > 0)
                {
                    foreach (var item in listGroup)
                    {
                        <div name="scholarRechart">
                            @*<h1>研究“@(item.GroupName)”的学者</h1>*@
                            <div id="relationChart_@item.GroupId"  data-groupid="@item.GroupId" data-groupname="@item.GroupName" style=" 600px; height: 400px;">

                            </div>
                        </div>

                    }
                }
            </div>
        </div>
js代码 实例化多个ECharts
    @if (listGrouping != null && listGrouping.Count > 0)
    {

        foreach (var item in listGrouping)
        {
            <text>
    @*var groupName = "@item.FirstOrDefault().GroupName";*@
    $(function () {
        var nodes_@item.Key = [{
            //category: 0,
            name: "@item.FirstOrDefault().GroupName",
            //color: "green",

            symbol: "circle",//"image://http://thumb12.jfcdns.com/2018-06/bce5b231ad7df722.png",
            symbolSize: 100,
            size: 100,
            label: "@item.FirstOrDefault().GroupName",
            x: null,
            y: null,
            draggable: true,
            //cursor:"pointer",
            label: {
                show: true,
                textStyle: {
                    color: '#333',
                    fontSize: 18,
                    fontWeight: "bolder"

                },
                position: 'inside',//标签位置
                //distance: 50//标签距离图形的距离
            },
        }];
        var links_@(item.Key) = [];
        @*var legendData_@(item.Key) = [];*@
        @{
            var subList = item.ToList();
            if (subList != null && subList.Count > 0)
        {


            foreach (var subItem in subList)
            {
            <text>

        nodes_@(item.Key).push({
            //category: 1,
            name: "@subItem.RealName",
            //color:"green",
            symbol: 'image://@ProductConfigHelper.DomainXinKeUrl/imagesTemp/potrait/0@(random.Next(1,6)).png',
            symbolSize: 60,
            size: 60,
            x: null,
            y: null,
            //draggable: true,
            scholarUrl: "@subItem.Link"
        });
        links_@(item.Key).push(
                                {
                                    source: "@subItem.RealName",
                                    target: "@subItem.GroupName",
                                    weight: 6,
                                    name: "@subItem.RealName"
                                });


        </text>
            }
           <text>
        //// 基于准备好的dom,初始化echarts实例
        var myChart_@(item.Key) = echarts.init(document.getElementById('relationChart_@item.Key'));
        option_@(item.Key) = {
            title: {
                text: '研究“@(item.FirstOrDefault().GroupName)”的学者',
                subtext: '',
                //x: 'middle',
                //y: 'top',
                //textStyle: {
                //    align: "center",
                //}
                //top: "middle",
                //bottom: "150",
                left: "center"
            },
            tooltip: {
                trigger: 'item',
                formatter: '{b}'
            },
            toolbox: {
                show: true,
                feature: {
                    //restore: { show: true },
                    magicType: { show: true, type: ['force', 'chord'] },
                    //saveAsImage: { show: true }
                }
            },
            @*legend: {
                x: 'left',
                data: legendData_@(item.Key)//['作者', '家人', '朋友']
            },//分类*@
            //edgeLength: [500, 100],
            series: [
                {
                    type: 'graph',
                    //name: "相关学者",
                    cursor: "pointer",
                    draggable: false,
                    layout: 'force',
                    //symbol: 'pin',
                    ribbonType: false,
                    //categories: seriesCategories,
                    cursor:'pointer',
                    itemStyle: {
                        normal: {
                            color: "#2ec7c9",//节点颜色
                            label: {
                                show: true,
                                textStyle: {
                                    color: '#333'
                                },
                                position: 'bottom',//标签位置
                                distance: 5//标签距离图形的距离
                            },
                            nodeStyle: {
                                brushType: 'both',
                                borderColor: 'rgba(255,215,0,0.4)',
                                borderWidth: 1
                            },
                            linkStyle: {
                                type: 'line'
                            }
                        },
                        emphasis: {
                            label: {
                                show: false
                                // textStyle: null      // 默认使用全局文本样式,详见TEXTSTYLE
                            },
                            nodeStyle: {
                                //r: 30
                            },
                            linkStyle: {}
                        }
                    },
                    //useWorker: false,
                    minRadius: 15,
                    maxRadius: 25,
                    //gravity: 0.1,
                    //scaling: 0.1,
                    roam: 'scale',//设置成可缩放
                    nodes: nodes_@(item.Key),
                    links: links_@(item.Key),

                    force: {
                        repulsion: 1000
                    }
                }
            ]
        };

        // 使用刚指定的配置项和数据显示图表。
        myChart_@(item.Key).setOption(option_@(item.Key));
        //节点点击事件
        myChart_@(item.Key).on('click', function (param) {
            if (param.data.scholarUrl) {
                window.open(param.data.scholarUrl);
            }
        });
        </text>
        }
    }
    })


    </text>
        }
    }
在script标签里,使用razor视图模板语法,在C#代码里输出js代码,使用<text></text>标签即可。
后台获取Echarts所需相关数据的方法及相关model
#region 获取相关学者列表
        /// <summary>
        /// 获取相关学者列表
        /// </summary>
        /// <param name="id"></param>
        /// <returns></returns>
        public JsonpResult GetScholarRelation(ScholarDto p)
        {
            if (string.IsNullOrEmpty(p.BookId))
            {
                return this.Jsonp(new { Success = 0, Msg = "查询失败:" + ":前台传参异常" });
            }
            var list = new List<ScholarDto>();//学者集合列表
            var groups = new List<ScholarDto>();//学者研究主题集合列表
            try
            {
                list=scholarService.GetScholarRelation(p);
                var group=list.GroupBy(c => c.GroupId);
                foreach (var item in group)
                {
                    groups.Add(new ScholarDto(){ GroupId=item.Key??0,GroupName=item.FirstOrDefault().GroupName});
                }
                return this.Jsonp(new { Success = 1, Msg = "查询成功", List = list, Group = groups });
            }
            catch (Exception ex)
            {
                return this.Jsonp(new { Success = 0, Msg = "查询失败:" + ex.Message });
            }
        }
        #endregion
 public partial class xk_scholar
    {
        public long Id { get; set; }
        public string BookId { get; set; }
        public string RealName { get; set; }
        public Nullable<long> GroupId { get; set; }
        public string Avatar { get; set; }
        public string Link { get; set; }
        public string Editor { get; set; }
        public Nullable<int> OrderNum { get; set; }
        public Nullable<System.DateTime> ADDTIME { get; set; }
        public Nullable<System.DateTime> UpdateTime { get; set; }
        public Nullable<int> IsDel { get; set; }
    }
 public class ScholarDto : xk_scholar
    {
        /// <summary>
        /// 研究主题名称
        /// </summary>
        public string GroupName { get; set; }
        /// <summary>
        /// 重新编码排序的研究主题编号,从1开始,用以使用插件echarts
        /// </summary>
        public int GroupCode { get; set; }
    }
前台脚本,控制图表显示与隐藏
 $(function () {
        var curGroupId=@(ViewBag.GroupId??0);

        if (curGroupId>0) {//通过左侧导航点击
            $(".choose a[data-groupid='{0}']".format(curGroupId)).click();

        }
        else {//默认第一条显示
            $(".choose a:eq(0)").click();

        }
        init_ready();//调整高度
    })
总结
切换分类,展示不同的ECharts,可以采用实例化多个ECharts,脚本控制图表的显示与隐藏。在script标签里,使用razor视图模板语法,在C#代码里输出js代码,使用<text></text>标签即可。