1.下载redis_exporter安装包(linux版)到 /opt/minitor/redis_exporter 。
下载地址:https://download.csdn.net/download/a15565772151/11111943
可以私聊我一下我发你资源
2.运行 tar -zxvf redis_exporter-v0.13.linux-amd64.tar.gz ,解压文件到当前目录。
3.执行 vim /opt/minitor/prometheus/prometheus.yml,添加以下配置文件(红色部分):
|
1
2
3
4
5
6
7
8
9
10
11
12
13
14
15
16
|
scrape_configs: # The job name is added as a label `job=<job_name>` to any timeseries scraped from this config. - job_name: 'prometheus' # metrics_path defaults to '/metrics' # scheme defaults to 'http'. static_configs: - targets: ['ip:9090'] labels: instance: prometheus - job_name: redis static_configs: - targets: ['ip:9121'] labels: instance: redis |
4.启动 redis_exporter
|
1
|
nohup ./redis_exporter -redis.addr ip:端口 -redis.password "密码" & |
5.去prometheus中查看redis的状态

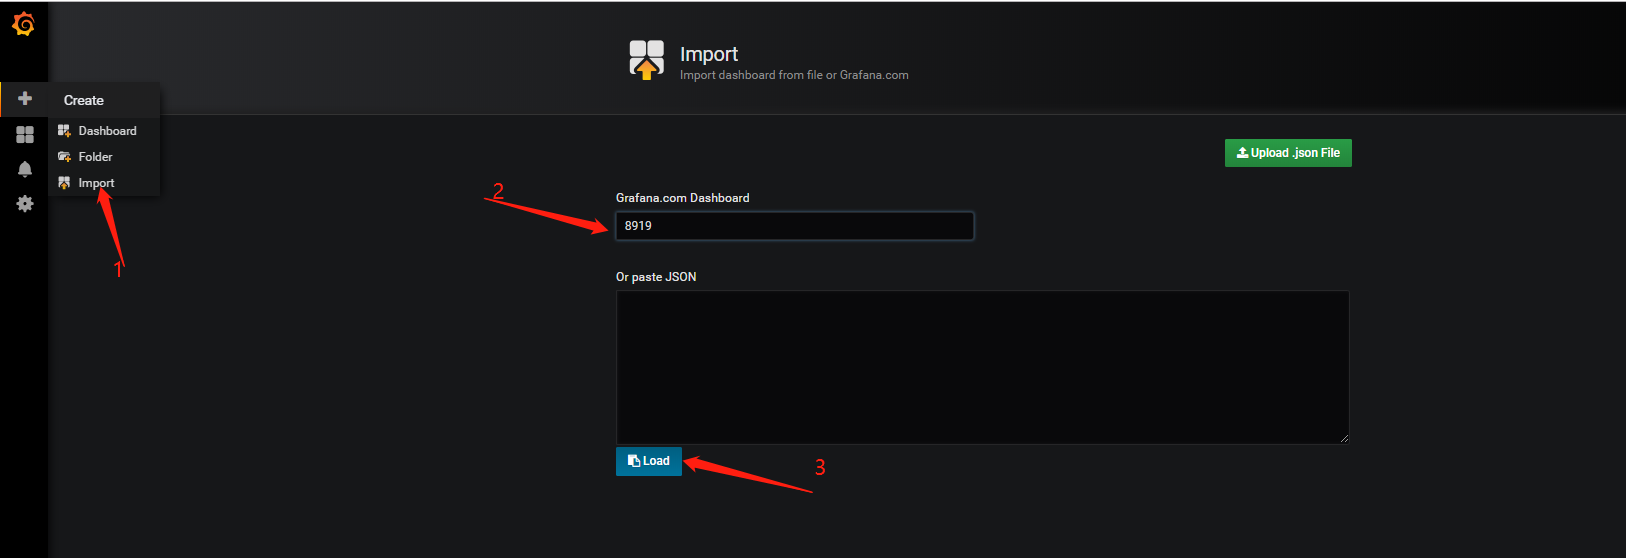
6.在grafana中查看配置状态(推荐使用763)
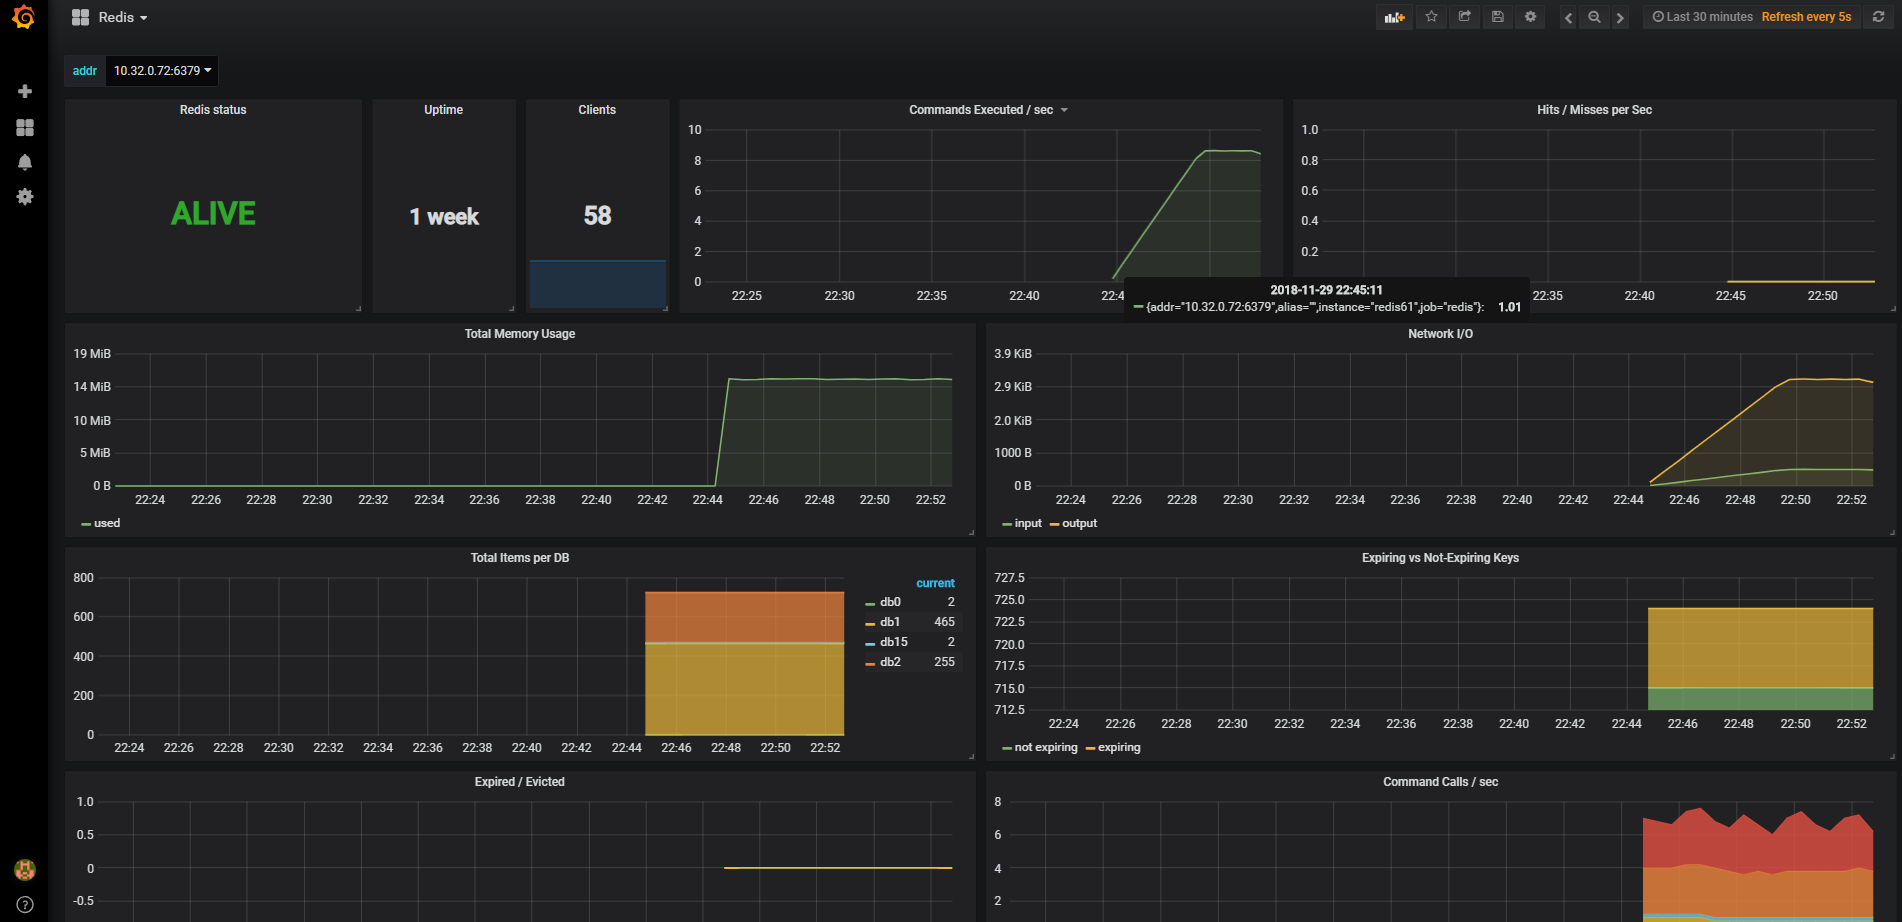
7.效果图如下: