1 使用插件名称Epplus,多个Sheet页数据应用,Demo为柱状图(Epplus支持多种图表)
2 Epplus 的安装和引用
新建一个工程文件或控制台应用程序 打开 Vs2017 Tools 的Nuget 包管理器,使用命令 install-package Epplus

3 开始在创建的工程中编写代码,实现功能

4 具体实现流程代码如下:


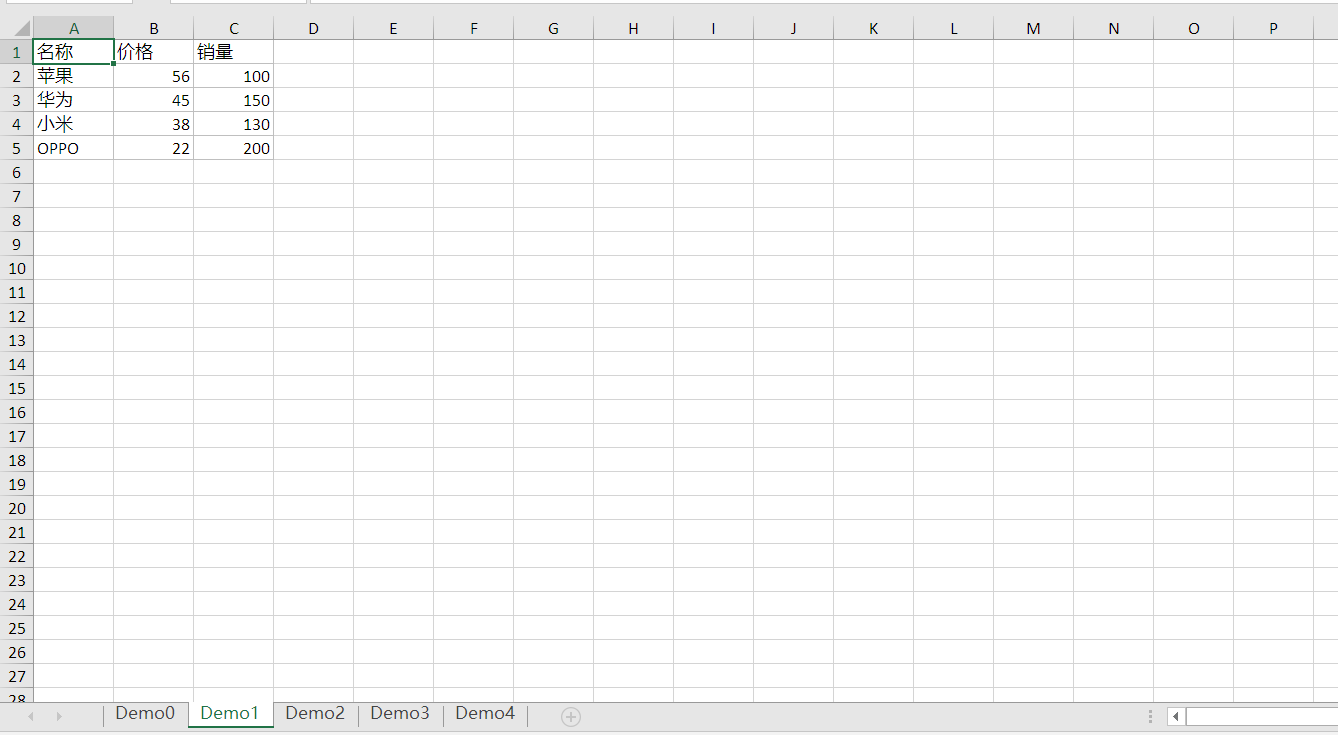
  1 using OfficeOpenXml;
  2 using OfficeOpenXml.Drawing;
  3 using OfficeOpenXml.Drawing.Chart;
  4 using OfficeOpenXml.Style;
  5 using System;
  6 using System.Collections.Generic;
  7 using System.Drawing;
  8 using System.IO;
  9 using System.Linq;
 10 using System.Text;
 11 using System.Threading.Tasks;
 12
 13 namespace EpplusTest
 14 {
 15     public class Program
 16     {
 17         static void Main(string[] args)
 18         {
 19             FileInfo newFile = new FileInfo(@"d:	est.xlsx");
 20             if (newFile.Exists)
 21             {
 22                 newFile.Delete();
 23                 newFile = new FileInfo(@"d:	est.xlsx");
 24             }
 25
 26             using (ExcelPackage package = new ExcelPackage(newFile))
 27             {
 28                 #region  创建多个Sheet页
 29                 for (int i = 0; i < 5; i++)
 30                 {
 31                     package.Workbook.Worksheets.Add("Demo" + i);
 32                 }
 33                 ExcelWorksheet worksheet = package.Workbook.Worksheets["Demo0"];
 34                 ExcelWorksheet worksheet1 = package.Workbook.Worksheets["Demo1"];
 35
 36                 #endregion
 37
 38                 #region 1 模拟填充数据
 39                 worksheet1.Cells[1, 1].Value = "名称";
 40                 worksheet1.Cells[1, 2].Value = "价格";
 41                 worksheet1.Cells[1, 3].Value = "销量";
 42
 43                 worksheet1.Cells[2, 1].Value = "苹果";
 44                 worksheet1.Cells[2, 2].Value = 56;
 45                 worksheet1.Cells[2, 3].Value = 100;
 46
 47                 worksheet1.Cells[3, 1].Value = "华为";
 48                 worksheet1.Cells[3, 2].Value = 45;
 49                 worksheet1.Cells[3, 3].Value = 150;
 50
 51                 worksheet1.Cells[4, 1].Value = "小米";
 52                 worksheet1.Cells[4, 2].Value = 38;
 53                 worksheet1.Cells[4, 3].Value = 130;
 54
 55                 worksheet1.Cells[5, 1].Value = "OPPO";
 56                 worksheet1.Cells[5, 2].Value = 22;
 57                 worksheet1.Cells[5, 3].Value = 200;
 58                 #endregion
 59
 60                 #region 2 构造图表
 61                 worksheet.Cells.Style.WrapText = true;
 62                 worksheet.View.ShowGridLines = false;//去掉sheet的网格线
 63                 using (ExcelRange range = worksheet.Cells[1, 1, 5, 3])
 64                 {
 65                     range.Style.HorizontalAlignment = ExcelHorizontalAlignment.Center;
 66                     range.Style.VerticalAlignment = ExcelVerticalAlignment.Center;
 67                 }
 68
 69                 using (ExcelRange range = worksheet.Cells[1, 1, 1, 3])
 70                 {
 71                     range.Style.Font.Bold = true;
 72                     range.Style.Font.Color.SetColor(Color.White);
 73                     range.Style.Font.Name = "微软雅黑";
 74                     range.Style.Font.Size = 12;
 75                     range.Style.Fill.PatternType = ExcelFillStyle.Solid;
 76                     range.Style.Fill.BackgroundColor.SetColor(Color.FromArgb(128, 128, 128));
 77                 }
 78
 79                 worksheet1.Cells[1, 1].Style.Border.BorderAround(ExcelBorderStyle.Thin, Color.FromArgb(191, 191, 191));
 80                 worksheet1.Cells[1, 2].Style.Border.BorderAround(ExcelBorderStyle.Thin, Color.FromArgb(191, 191, 191));
 81                 worksheet1.Cells[1, 3].Style.Border.BorderAround(ExcelBorderStyle.Thin, Color.FromArgb(191, 191, 191));
 82
 83                 worksheet1.Cells[2, 1].Style.Border.BorderAround(ExcelBorderStyle.Thin, Color.FromArgb(191, 191, 191));
 84                 worksheet1.Cells[2, 2].Style.Border.BorderAround(ExcelBorderStyle.Thin, Color.FromArgb(191, 191, 191));
 85                 worksheet1.Cells[2, 3].Style.Border.BorderAround(ExcelBorderStyle.Thin, Color.FromArgb(191, 191, 191));
 86
 87                 worksheet1.Cells[3, 1].Style.Border.BorderAround(ExcelBorderStyle.Thin, Color.FromArgb(191, 191, 191));
 88                 worksheet1.Cells[3, 2].Style.Border.BorderAround(ExcelBorderStyle.Thin, Color.FromArgb(191, 191, 191));
 89                 worksheet1.Cells[3, 3].Style.Border.BorderAround(ExcelBorderStyle.Thin, Color.FromArgb(191, 191, 191));
 90
 91                 worksheet1.Cells[4, 1].Style.Border.BorderAround(ExcelBorderStyle.Thin, Color.FromArgb(191, 191, 191));
 92                 worksheet1.Cells[4, 2].Style.Border.BorderAround(ExcelBorderStyle.Thin, Color.FromArgb(191, 191, 191));
 93                 worksheet1.Cells[4, 3].Style.Border.BorderAround(ExcelBorderStyle.Thin, Color.FromArgb(191, 191, 191));
 94
 95                 worksheet1.Cells[5, 1].Style.Border.BorderAround(ExcelBorderStyle.Thin, Color.FromArgb(191, 191, 191));
 96                 worksheet1.Cells[5, 2].Style.Border.BorderAround(ExcelBorderStyle.Thin, Color.FromArgb(191, 191, 191));
 97                 worksheet1.Cells[5, 3].Style.Border.BorderAround(ExcelBorderStyle.Thin, Color.FromArgb(191, 191, 191));
 98
 99                 ExcelChart chart = worksheet.Drawings.AddChart("chart", eChartType.ColumnClustered);
100                 ExcelChartSerie serie = chart.Series.Add(worksheet1.Cells[2, 3, 5, 3], worksheet1.Cells[2, 1, 5, 1]);//引用worksheet1的数据填充图表的X轴和Y轴
101                 serie.HeaderAddress = worksheet1.Cells[1, 3];
102                 #endregion
103
104                 #region 3 设置图表的样式
105                 chart.SetPosition(40, 10);
106                 chart.SetSize(500, 300);
107                 chart.Title.Text = "销量走势";
108                 chart.Title.Font.Color = Color.FromArgb(89, 89, 89);
109                 chart.Title.Font.Size = 15;
110                 chart.Title.Font.Bold = true;
111                 chart.Style = eChartStyle.Style15;
112                 chart.Legend.Border.LineStyle = eLineStyle.SystemDash;
113                 chart.Legend.Border.Fill.Color = Color.FromArgb(217, 217, 217);
114                 #endregion
115                 package.Save();
116             }
117         }
118     }
119 }
5 效果展示:
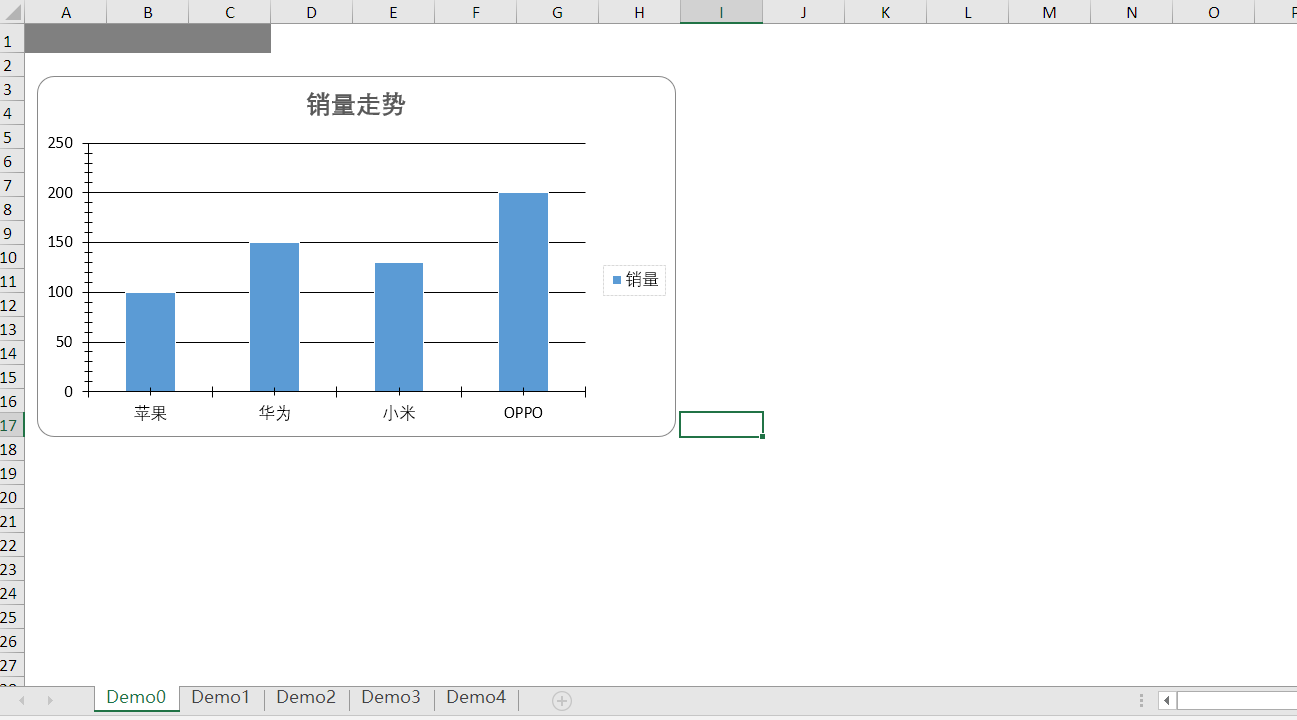
6 Demo源码GitHub下载地址:https://github.com/HJ520134/.NetDemo.git