


实践:
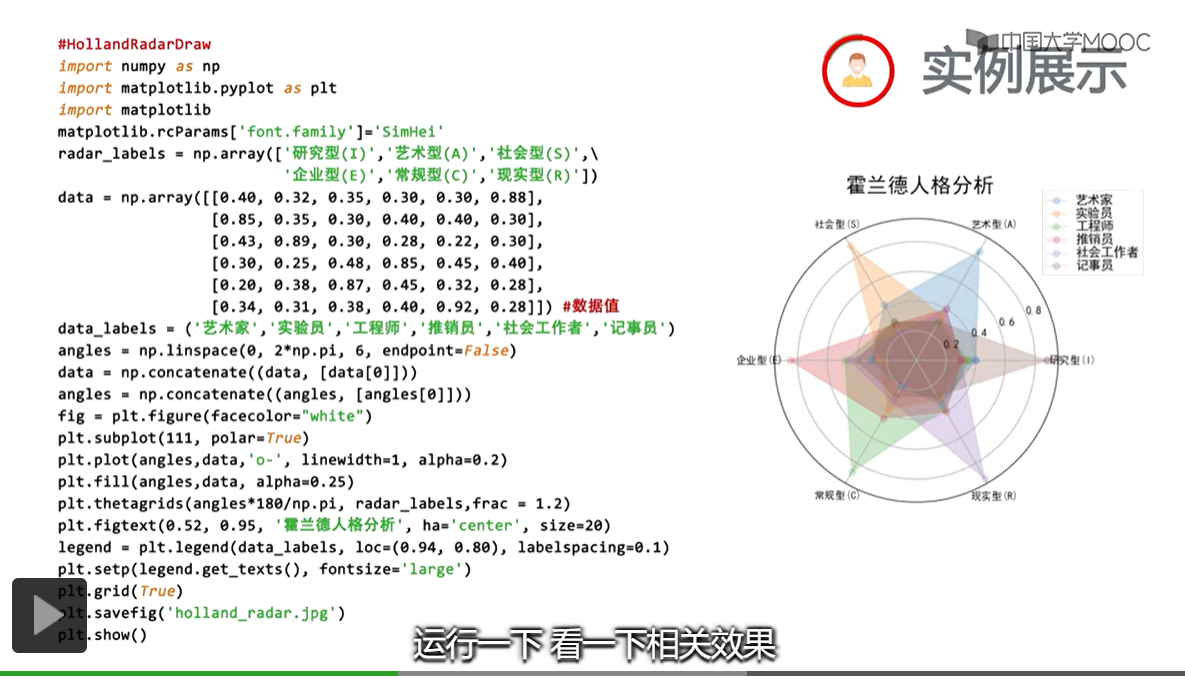
#引入第三方库
import numpy as np
import matplotlib.pyplot as plt
import matplotlib
matplotlib.rcParams['font.family']='SimHei'#字体
radar_labels=np.array(['研究型(I)','艺术型(A)','社会型(S)',
                    '企业型(E)','常规型(C)','现实型(R)'])#类型
#数据
data=np.array([[0.40,0.32,0.35,0.30,0.30,0.88],
              [0.85,0.35,0.30,0.40,0.40,0.30],
              [0.43,0.89,0.30,0.28,0.22,0.30],
              [0.30,0.25,0.48,0.85,0.45,0.40],
              [0.20,0.38,0.87,0.45,0.32,0.28],
              [0.34,0.31,0.38,0.40,0.92,0.28]])
#处理
data_labels=('艺术家','实验员','工程师','推销员','社会工作者','记事员')
angles=np.linspace(0,2*np.pi,6,endpoint=False)
data=np.concatenate((data,[data[0]]))
angles=np.concatenate((angles,[angles[0]]))
fig=plt.figure(facecolor="white")
plt.subplot(111,polar=True)
plt.plot(angles,data,'o-',linewidth=1,alpha=0.2)
plt.fill(angles,data,alpha=0.25)
plt.thetagrids(angles*180/np.pi,radar_labels)#这里会报错,因为使用的是库的最新版本,其方法内部是不需要使用到frac,去掉即可。
plt.figtext(0.52,0.95,'霍兰德人格分析',ha='center',size=20)
legend=plt.legend(data_labels,loc=(0.94,0.80),labelspacing=0.1)
plt.setp(legend.get_texts(),fontsize='large')
plt.grid(True)
plt.savefig('holland_radar.jpg')
plt.show
运行结果: