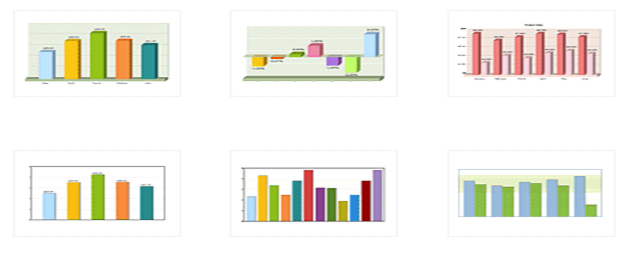
先了解fusioncharts插件,fusioncharts是一款基于XML和flash的报表组件,支持Java、PHP、AngularJS等等开发语言,所以,开发出来,加入swf文件,就可以出现动态效果的报表统计,具有2D和3D效果的图表,下面是官网和详细分类
官网:http://www.fusioncharts.com/
Fusioncharts插件的分类:
1、3D/2D柱形图

2、曲线图

3、3D/2D饼形图和环形图

4、 区域图

先去官网下载Fusioncharts免费版本需要的swf和Javascript以及jar等等资料,http://www.fusioncharts.com/goodies/fusioncharts-free/
或者去http://download.csdn.net/detail/u014427391/9722565
http://download.csdn.net/detail/u014427391/9722584下载

fusionChartsHtmlReader.jsp:
<% /* Version 2.0: * Added DOMId to FlashVars * Version 1.1: * Works with all jdk versions >=1.4. * Creates the object tag required to embed a chart. * Generates the object tag to embed the swf directly into the html page.<br> * Note: Only one of the parameters strURL or strXML has to be not null for this<br> * method to work. If both the parameters are provided then strURL is used for further processing.<br> * * @param chartSWF - * SWF File Name (and Path) of the chart which you intend * to plot * @param strURL - * If you intend to use dataURL method for this chart, * pass the URL as this parameter. Else, set it to "" (in * case of dataStr method) * @param strXML - * If you intend to use dataStr method for this chart, * pass the XML data as this parameter. Else, set it to "" * (in case of dataURL method) * @param chartId - * Id for the chart, using which it will be recognized in * the HTML page. Each chart on the page needs to have a * unique Id. * @param chartWidth - * Intended width for the chart (in pixels) * @param chartHeight - * Intended height for the chart (in pixels) * @param debugMode - * Whether to start the chart in debug mode (Not used in Free version) * @param wMode - Window mode * @param color - Background color * @param scaleMode - "noScale", "exactFit" * @param lang - Application Message Language - 2 letter code */ %> <% String chartSWF= request.getParameter("chartSWF"); String strURL= request.getParameter("strURL"); String strXML= request.getParameter("strXML"); String chartId= request.getParameter("chartId"); String chartWidthStr= request.getParameter("chartWidth"); String chartHeightStr= request.getParameter("chartHeight"); String debugModeStr= request.getParameter("debugMode"); // not used in Free version String registerWithJSStr= request.getParameter("registerWithJS"); String wMode = request.getParameter("wMode"); String color = request.getParameter("color"); String scaleMode = request.getParameter("scaleMode"); String lang = request.getParameter("lang"); int chartWidth= 0; int chartHeight=0; Boolean debugMode=new Boolean("false"); Boolean registerWithJS=new Boolean("false"); int debugModeInt =0; int regWithJSInt =0; if(null!=chartWidthStr && !chartWidthStr.equals("")){ chartWidth = Integer.parseInt(chartWidthStr); } if(null!=chartHeightStr && !chartHeightStr.equals("")){ chartHeight = Integer.parseInt(chartHeightStr); } if(null!=debugModeStr && !debugModeStr.equals("")){ debugMode = new Boolean(debugModeStr); debugModeInt= boolToNum(debugMode); } if(null!=registerWithJSStr && !registerWithJSStr.equals("")){ registerWithJS = new Boolean(registerWithJSStr); regWithJSInt=boolToNum(registerWithJS); } if(wMode==null) wMode=""; if(scaleMode==null) scaleMode=""; if(color==null) color=""; if(lang==null) lang=""; String strFlashVars=""; strFlashVars = "chartWidth=" + chartWidth + "&chartHeight=" + chartHeight + "&DOMId=" + chartId + "&debugMode=" + debugModeInt + "®isterWithJS=" + regWithJSInt; if (strXML==null || strXML.equals("")) { // DataURL Mode strFlashVars +="&dataURL=" + strURL + ""; } else { // dataStr Mode strFlashVars += "&dataXML=" + strXML + ""; } strFlashVars+= "&scaleMode=" + scaleMode+ "&lang=" + lang; %> <!--START Code Block for Chart <%=chartId%> --> <object classid="clsid:d27cdb6e-ae6d-11cf-96b8-444553540000" codebase="http://fpdownload.macromedia.com/pub/shockwave/cabs/flash/swflash.cab#version=8,0,0,0" width="<%= chartWidth%>" height="<%= chartHeight%>" id="<%= chartId%>"> <param name="allowScriptAccess" value="always" /> <param name="movie" value="<%=chartSWF%>"/> <param name="FlashVars" value="<%=strFlashVars%>" /> <param name="quality" value="high" /> <param name="wmode" value="<%=wMode%>" /> <param name="bgcolor" value="<%=color%>" /> <embed src="<%=chartSWF%>" FlashVars="<%=strFlashVars%>" quality="high" width="<%=chartWidth%>" height="<%=chartHeight%>" name="<%=chartId%>" allowScriptAccess="always" type="application/x-shockwave-flash" pluginspage="http://www.macromedia.com/go/getflashplayer" wmode="transparent" bgcolor="<%=color%>" /> </object> <!--END Code Block for Chart <%=chartId%> --> <%! /** * Converts a Boolean value to int value<br> * * @param bool Boolean value which needs to be converted to int value * @return int value correspoding to the boolean : 1 for true and 0 for false */ public int boolToNum(Boolean bool) { int num = 0; if (bool.booleanValue()) { num = 1; } return num; } %>
fusionChartsReader.jsp:
<%@page import="com.fusioncharts.helper.FCParameters" %>
<%
    /*
     * Version 2.0:
     * Added JS v3.2 constructor call with object style parameters.
     * Added strJSON, dataFormat, renderer and renderAt as parameters.
     * Version: 1.1:
     * Added support for all the parameters like wMode etc.
     * Works with all jdk versions >=1.4.
     * Creates the JavaScript + HTML code required to embed a chart.<br>
     * Uses the javascript FusionCharts class to create the chart by supplying <br>
     * the required parameters to it.<br>
     * Note: Only one of the parameters dataURL or dataStr has to be non-empty for this<br>
     * method to work. If both the parameters are provided then dataURL is used for further processing.<br>
     *
     * @param chartSWF -
     *                SWF File Name (and Path) of the chart which you intend
     *                to plot
     * @param strURL -
     *                If you intend to use dataURL method for this chart,
     *                pass the URL as this parameter. Else, set it to "" (in
     *                case of dataStr method)
     * @param strXML -
     *                If you intend to use dataStr method for this chart,
     *                pass the XML data as this parameter. Else, set it to ""
     *                (in case of dataURL method)
     * @param strJSON -
     *                If you intend to use dataStr method for this chart,
     *                pass the JSON data as this parameter. Else, set it to ""
     *                (in case of dataURL/xml method)
     * @param chartId -
     *                Id for the chart, using which it will be recognized in
     *                the HTML page. Each chart on the page needs to have a
     *                unique Id.
     * @param chartWidth -
     *                Intended width for the chart (in pixels)
     * @param chartHeight -
     *                Intended height for the chart (in pixels)
     * @param debugMode -
     *                Whether to start the chart in debug mode
     * @param registerWithJS -
     *                Whether to ask chart to register itself with
     *                JavaScript
     * @param wMode -
     * @param color -
     * @param scaleMode -
     * @param lang -
     * @param detectFlashVersion -
     * @param autoInstallRedirect -
     */
%>
<%
    String chartSWF = request.getParameter("chartSWF");
    String strURL = request.getParameter("strURL");
    String strXML = request.getParameter("strXML");
    String strJSON = request.getParameter("strJSON");
    String chartId = request.getParameter("chartId");
    String chartWidthStr = request.getParameter("chartWidth");
    String chartHeightStr = request.getParameter("chartHeight");
    String debugModeStr= request.getParameter("debugMode");
    String registerWithJSStr= request.getParameter("registerWithJS");

    String wMode = request.getParameter("wMode");
    String color = request.getParameter("color");
    String scaleMode = request.getParameter("scaleMode");
    String lang = request.getParameter("lang");
    String detectFlashVersion = request.getParameter("detectFlashVersion");
    String autoInstallRedirect= request.getParameter("autoInstallRedirect");

    String dataFormat= request.getParameter("dataFormat");
    String renderer= request.getParameter("renderer");
    String renderAt= request.getParameter("renderAt");

    int chartWidth = 600;
    int chartHeight = 300;
    Boolean debugMode=new Boolean("false");
    Boolean registerWithJS=new Boolean("false");
    int debugModeInt = 0;
    int regWithJSInt = 0;


    if (null != chartWidthStr && !chartWidthStr.equals("")) {
        chartWidth = Integer.parseInt(chartWidthStr);
    }
    if (null != chartHeightStr && !chartHeightStr.equals("")) {
        chartHeight = Integer.parseInt(chartHeightStr);
    }
    if(null!=debugModeStr && !debugModeStr.equals("")){
        debugMode = new Boolean(debugModeStr);
        debugModeInt=boolToNum(debugMode);
    }
    if(null!=registerWithJSStr && !registerWithJSStr.equals("")){
        registerWithJS = new Boolean(registerWithJSStr);
        regWithJSInt=boolToNum(registerWithJS);
    }
    if(renderer==null)
        renderer="flash"; // default value
    if(renderAt==null)
        renderAt=chartId+"Div";


    String dataSource = "";
    // Check whether we've to provide data using dataStr method or dataURL
    // method

    if (strURL!=null && !strURL.equals("")) {
        dataSource = strURL;
        dataFormat =( dataFormat==null ? "xmlurl" : dataFormat);
    } else if(strXML!=null && !strXML.equals("")){
        dataSource = strXML;
        dataFormat =( dataFormat==null ? "xml" : dataFormat);
    }else if(strJSON!=null && !strJSON.equals("")){
        dataSource = strJSON;
        dataFormat =( dataFormat==null ? "json" : dataFormat);
    }

    FCParameters fcParams = new FCParameters(chartSWF, chartId,
            ""+chartWidth, ""+chartHeight, "" + debugModeInt, "" + regWithJSInt,
            wMode, color, scaleMode, lang, detectFlashVersion,
            autoInstallRedirect, dataSource, dataFormat, renderer,
            renderAt);
    String paramsInJSON = fcParams.toJSON();
%>
            <!-- START Script Block for Chart <%=chartId%> -->
            <% if(renderAt.equals(chartId+"Div")) {
            // output this chartIdDiv div only if chart is being rendered in it
            %>
            <div id='<%=chartId %>Div' align='center'>Chart.</div>
            <% } %>
            <script type='text/javascript'>
                var chart_<%=chartId%> = new FusionCharts(<%=paramsInJSON%>).render();
            </script>
            <!--END Script Block for Chart <%=chartId%> -->
<%!
    /**
     * Converts a Boolean value to int value<br>
     *
     * @param bool Boolean value which needs to be converted to int value
     * @return int value correspoding to the boolean : 1 for true and 0 for false
     */
   public int boolToNum(Boolean bool) {
    int num = 0;
    if (bool.booleanValue()) {
        num = 1;
    }
    return num;
    }
%>
写个index.jsp:
Javascript:
<script type="text/javascript">

    function selectType(){
        var typeValue = $("#combobox").val();
        window.location.href="fusioncharts/selectType?type="+typeValue;

    }
  </script>
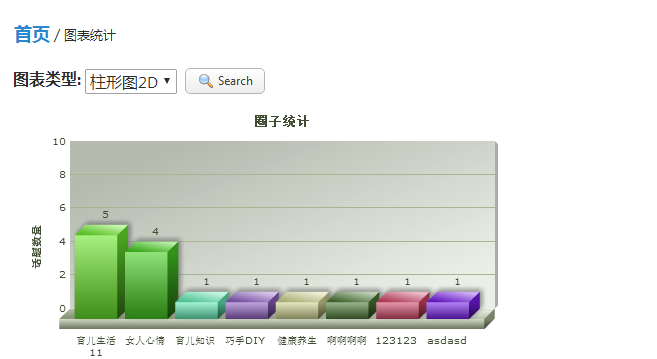
<!--[if lte IE 9]> <p class="browsehappy">你正在使用<strong>过时</strong>的浏览器,系统 暂不支持。 请 <a href="http://browsehappy.com/" target="_blank">升级浏览器</a> 以获得更好的体验!</p> <![endif]--> <!-- 页面顶部¨ --> <%@ include file="../admin/head.jsp"%> <div class="am-cf admin-main"> <!-- 左侧菜单• --> <%@ include file="../admin/left.jsp"%> <!-- content start --> <div class="admin-content"> <div class="am-cf am-padding"> <div class="am-fl am-cf"><strong class="am-text-primary am-text-lg"><a href="main/index">首页</a></strong> / <small>图表统计</small></div> </div> <div class="am-g"> <div class="am-u-sm-12"> <div style="float:left;"> <label>图表类型:</label> <select id="combobox"> <option value="Column2D">柱形图2D</option> <option value="Column3D">柱形图3D</option> <option value="Pie2D">扇形图2D</option> <option value="Pie3D">扇形图3D</option> </select> <a href="javascript:selectType();" class="easyui-linkbutton" data-options="iconCls:'icon-search'" style="80px">Search</a> <table border="0" width="50%"> <tr> <td><jsp:include page="fusionChartsHTMLRenderer.jsp" flush="true"> <jsp:param name="chartSWF" value="${typeValue }" /> <jsp:param name="strURL" value="" /> <jsp:param name="strXML" value="${strXML }" /> <jsp:param name="chartId" value="myNext" /> <jsp:param name="chartWidth" value="500" /> <jsp:param name="chartHeight" value="300" /> <jsp:param name="debugMode" value="false" /> </jsp:include> </td> </tr> </table> </div> </div> </div> </div> <!-- content end --> </div> <!-- basic scripts --> <script src="source/1.9.1/jquery.min.js"></script> </div>
SpringMVC框架写个Controller类:
package com.appms.controller.fusioncharts;

import java.util.List;
import java.util.Random;

import javax.annotation.Resource;

import org.springframework.stereotype.Controller;
import org.springframework.web.bind.annotation.RequestMapping;
import org.springframework.web.servlet.ModelAndView;

import com.appms.base.BaseController;
import com.appms.entity.PageData;
import com.appms.service.app.GroupClassifyService;
import com.appms.service.app.GroupPostService;

@Controller
@RequestMapping("/fusioncharts")
public class FusionChartsController extends BaseController{

    @Resource(name="groupClassifyService")
    GroupClassifyService groupClassifyService;
    @Resource(name="groupPostService")
    GroupPostService groupPostService;

    /**
     * 统计报表首页
     * @return
     * @throws Exception
     */
    @RequestMapping("/index")
    public ModelAndView goIndex() throws Exception{
        ModelAndView mv = this.getModelAndView();
        List<PageData> classifyList = groupClassifyService.getAllClassify();
        mv.setViewName("fusioncharts/fusioncharts_index");
        String strXML = "";
        strXML += "<graph caption='对比表' xAxisName='圈子' yAxisName='话题数量' decimalPrecision='0' formatNumberScale='0'>";
        for(int i=0;i<classifyList.size();i++){
        strXML += "<set name='"+classifyList.get(i).getString("classifyName")+
                "' value='"+groupPostService.countPost(classifyList.get(i).get("classifyID").toString())+
                "' color='"+randomColor()+"'/>";
        }
        strXML += "</graph>";
        String typeValue = "source/FusionCharts/Column2D.swf";
        mv.addObject("strXML",strXML);
        mv.addObject("typeValue",typeValue);
        return mv;
    }
    /**
     * 选择图表类型
     * @return
     * @throws Exception
     */
    @RequestMapping(value="/selectType")
    public ModelAndView selectType()throws Exception{
        ModelAndView model = this.getModelAndView();
        List<PageData> classifyList = groupClassifyService.getAllClassify();
        PageData pd = new PageData();
        pd = this.getPageData();
        String type = pd.getString("type");
        String typeValue = "source/FusionCharts/Column2D.swf";
        if(type.equals("Column2D")){
            typeValue = "source/FusionCharts/Column2D.swf";
        }else if(type.equals("Column3D")){
            typeValue = "source/FusionCharts/Column3D.swf";
        }else if(type.equals("Pie2D")){
            typeValue = "source/FusionCharts/Pie2D.swf";
        }else if(type.equals("Pie3D")){
            typeValue = "source/FusionCharts/Pie3D.swf";
        }
        String strXML = "";
        strXML += "<graph caption='圈子统计' xAxisName='圈子' yAxisName='话题数量' decimalPrecision='0' formatNumberScale='0'>";
        for(int i=0;i<classifyList.size();i++){
        strXML += "<set name='"+classifyList.get(i).getString("classifyName")+
                "' value='"+groupPostService.countPost(classifyList.get(i).get("classifyID").toString())+
                "' color='"+randomColor()+"'/>";
        }
        strXML += "</graph>";
        model.addObject("strXML", strXML);
        model.addObject("typeValue",typeValue);
        model.setViewName("fusioncharts/fusioncharts_index");
        return model;
    }

    public String randomColor(){
        //红色
        String red;
        //绿色
        String green;
        //蓝色
        String blue;
        //生成随机对象
        Random random = new Random();
        //生成红色颜色代码
        red = Integer.toHexString(random.nextInt(256)).toUpperCase();
        //生成绿色颜色代码
        green = Integer.toHexString(random.nextInt(256)).toUpperCase();
        //生成蓝色颜色代码
        blue = Integer.toHexString(random.nextInt(256)).toUpperCase();

        //判断红色代码的位数
        red = red.length()==1 ? "0" + red : red ;
        //判断绿色代码的位数
        green = green.length()==1 ? "0" + green : green ;
        //判断蓝色代码的位数
        blue = blue.length()==1 ? "0" + blue : blue ;
        //生成十六进制颜色值
        String color = "#"+red+green+blue;
        return color;
    }

}
