- 简介
在数据挖掘的过程中,我们可能会经常遇到一些偏离于预测趋势之外的数据,通常我们称之为异常值。
通常将这样的一些数据的出现归为误差。有很多情况会出现误差,具体的情况需要就对待:
传感器故障 -> 忽略
数据输入错误 -> 忽略
反常事件 -> 重视
- 异常值检测/删除算法
1、训练数据
2、异常值检测,找出训练集中访问最多的点,去除这些点(一般约10%的异常数据)
3、再训练
需要多次重复2、3步骤
例:对数据第一次使用回归后的拟合

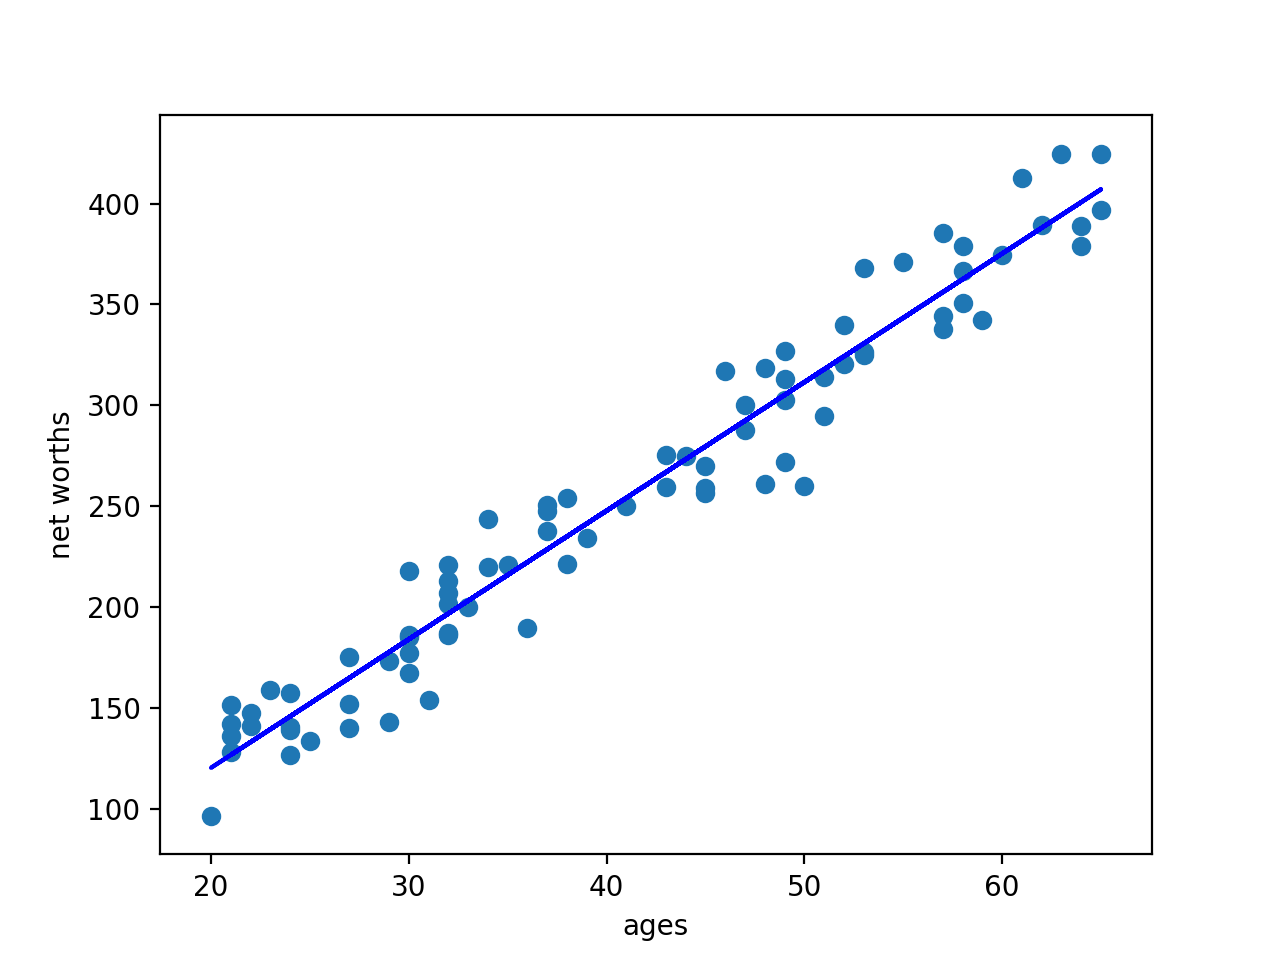
误差点的出现使拟合线相对偏离,将误差点去除后进行一次回归:

去除误差点后的回归线很好的对数据进行了拟合
- 代码实现
环境:MacOS mojave 10.14.3
Python 3.7.0
使用库:scikit-learn 0.19.2
原始数据集:

对原始数据进行一次回归:

删除10%的异常值后进行一次回归:

outlier_removal_regression.py 主程序
#!/usr/bin/python

import random
import numpy
import matplotlib.pyplot as plt
import pickle

from outlier_cleaner import outlierCleaner

class StrToBytes:
    def __init__(self, fileobj):
        self.fileobj = fileobj
    def read(self, size):
        return self.fileobj.read(size).encode()
    def readline(self, size=-1):
        return self.fileobj.readline(size).encode()


### load up some practice data with outliers in it
ages = pickle.load(StrToBytes(open("practice_outliers_ages.pkl", "r") ) )
net_worths = pickle.load(StrToBytes(open("practice_outliers_net_worths.pkl", "r") ) )


### ages and net_worths need to be reshaped into 2D numpy arrays
### second argument of reshape command is a tuple of integers: (n_rows, n_columns)
### by convention, n_rows is the number of data points
### and n_columns is the number of features
ages       = numpy.reshape( numpy.array(ages), (len(ages), 1))
net_worths = numpy.reshape( numpy.array(net_worths), (len(net_worths), 1))
from sklearn.cross_validation import train_test_split
ages_train, ages_test, net_worths_train, net_worths_test = train_test_split(ages, net_worths, test_size=0.1, random_state=42)

### fill in a regression here!  Name the regression object reg so that
### the plotting code below works, and you can see what your regression looks like


from sklearn import linear_model
reg = linear_model.LinearRegression()
reg.fit(ages_train,net_worths_train)
print (reg.coef_)
print (reg.intercept_)
print (reg.score(ages_test,net_worths_test) )


try:
    plt.plot(ages, reg.predict(ages), color="blue")
except NameError:
    pass
plt.scatter(ages, net_worths)
plt.show()


### identify and remove the most outlier-y points
cleaned_data = []
try:
    predictions = reg.predict(ages_train)
    cleaned_data = outlierCleaner( predictions, ages_train, net_worths_train )

except NameError:
    print ("your regression object doesn't exist, or isn't name reg")
    print ("can't make predictions to use in identifying outliers")


### only run this code if cleaned_data is returning data
if len(cleaned_data) > 0:
    ages, net_worths, errors = zip(*cleaned_data)
    ages       = numpy.reshape( numpy.array(ages), (len(ages), 1))
    net_worths = numpy.reshape( numpy.array(net_worths), (len(net_worths), 1))

    ### refit your cleaned data!
    try:
        reg.fit(ages, net_worths)
        plt.plot(ages, reg.predict(ages), color="blue")
        print (reg.coef_)
        print (reg.intercept_)
        print (reg.score(ages_test,net_worths_test) )
    except NameError:
        print ("you don't seem to have regression imported/created,")
        print ("   or else your regression object isn't named reg")
        print ("   either way, only draw the scatter plot of the cleaned data")
    plt.scatter(ages, net_worths)
    plt.xlabel("ages")
    plt.ylabel("net worths")
    plt.show()


else:
    print ("outlierCleaner() is returning an empty list, no refitting to be done")
outlier_cleaner.py 清除10%的异常值
import numpy as np
import math

def outlierCleaner(predictions, ages, net_worths):
    """
        Clean away the 10% of points that have the largest
        residual errors (difference between the prediction
        and the actual net worth).
        Return a list of tuples named cleaned_data where
        each tuple is of the form (age, net_worth, error).
    """

    cleaned_data = []


    ages = ages.reshape((1,len(ages)))[0]
    net_worths = net_worths.reshape((1,len(ages)))[0]
    predictions = predictions.reshape((1,len(ages)))[0]
    # zip() 函数用于将可迭代的对象作为参数,将对象中对应的元素打包成一个个元组,然后返回由这些元组组成的列表。
    cleaned_data = zip(ages,net_worths,abs(net_worths-predictions))
    #按照error大小排序
    cleaned_data = sorted(cleaned_data , key=lambda x: (x[2]))
    #ceil() 函数返回数字的上入整数,计算要删除的元素个数
    cleaned_num = int(-1 * math.ceil(len(cleaned_data)* 0.1))
    #切片
    cleaned_data = cleaned_data[:cleaned_num]

    return cleaned_data
同时得到这两次回归的拟合优度:
第一次:0.8782624703664675
第二次:0.983189455395532
可见,去除异常值对于预测数据具有重要作用