被监控机器环境搭建&配置
nginx-module-vts下载:
https://github.com/vozlt/nginx-module-vts
nginx-module-vts安装
unzip nginx-module-vts-master.zip
mv nginx-module-vts-master /usr/local/
编译环境:
yum -y install gcc gcc-c++ pcre pcre-devel zlib zlib-devel openssl openssl-devel
安装nginx:
wget nginx.org/download/nginx-1.15.7.tar.gz
./configure --add-module=/usr/local/nginx-module-vts/
nginx配置server中添加:
location /status {
vhost_traffic_status_display;
vhost_traffic_status_display_format html;
}
}
http中添加:
vhost_traffic_status_zone;
启动nginx:
/usr/local/nginx/sbin/nginx
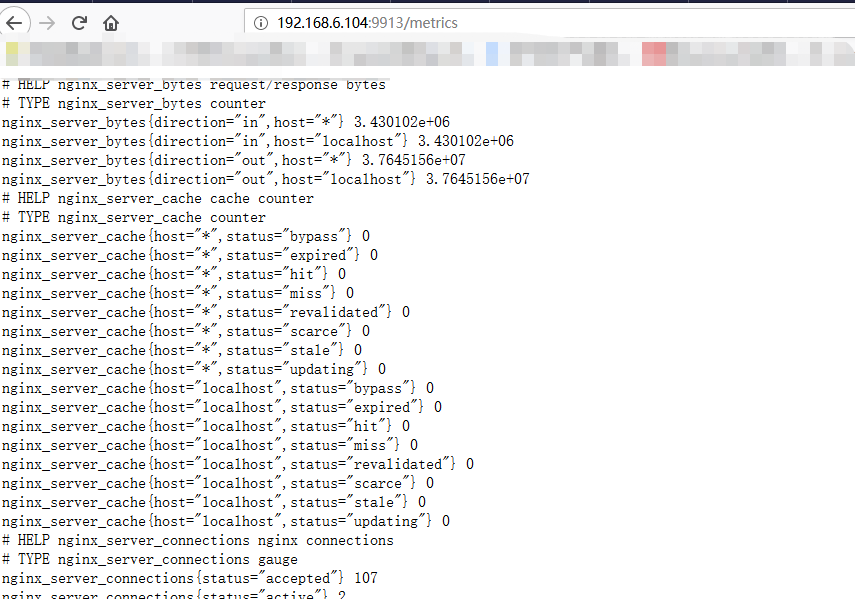
完成以上步骤可以访问:

安装nginx-vts-exporter
wget -O nginx-vts-exporter-0.5.zip https://github.com/hnlq715/nginx-vts-exporter/archive/v0.5.zip
unzip nginx-vts-exporter-0.5.zip
mv nginx-vts-exporter-0.5 /usr/local/prometheus/nginx-vts-exporter
chmod +x /usr/local/prometheus/nginx-vts-exporter/bin/nginx-vts-exporter
cd /usr/local/nginx-vts-exporter/bin
./nginx-vts-exporter -nginx.scrape_uri http://192.168.6.104/status/format/json &
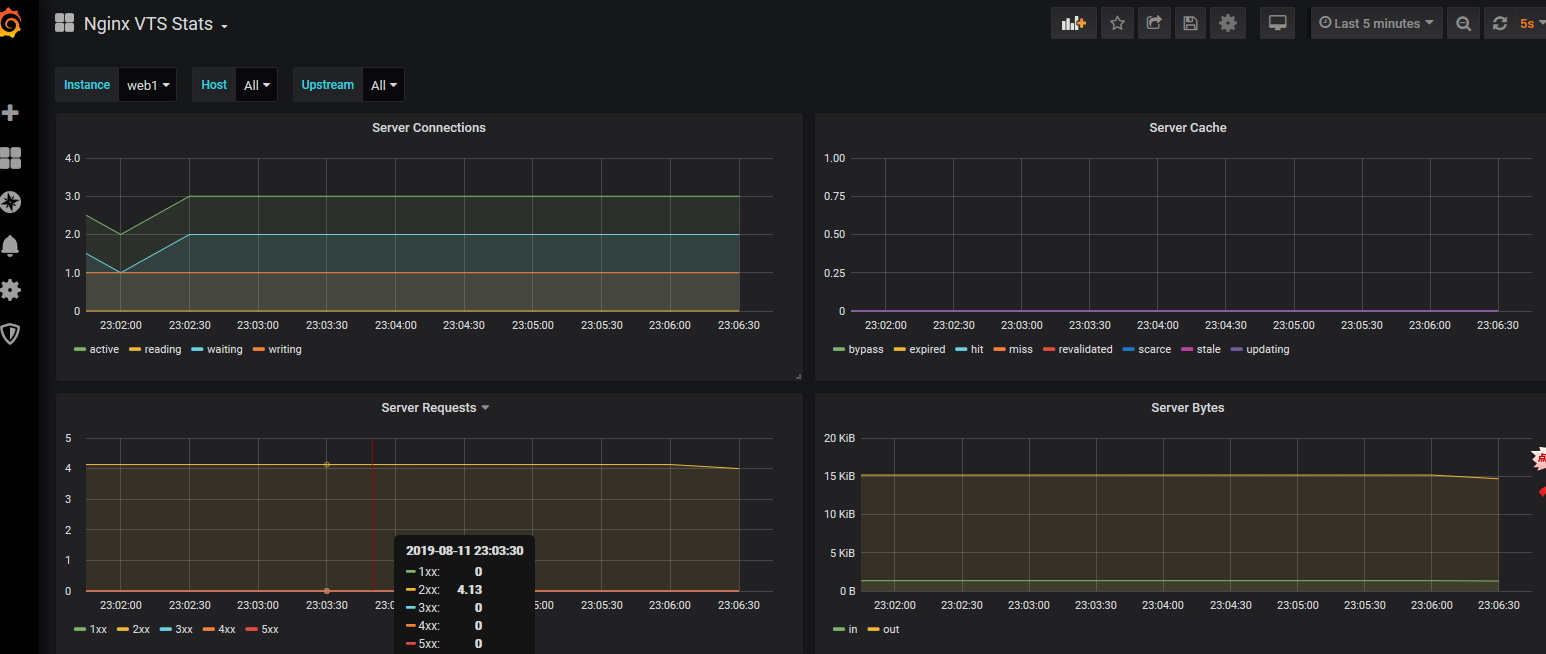
prometheus机器grafana配置及操作
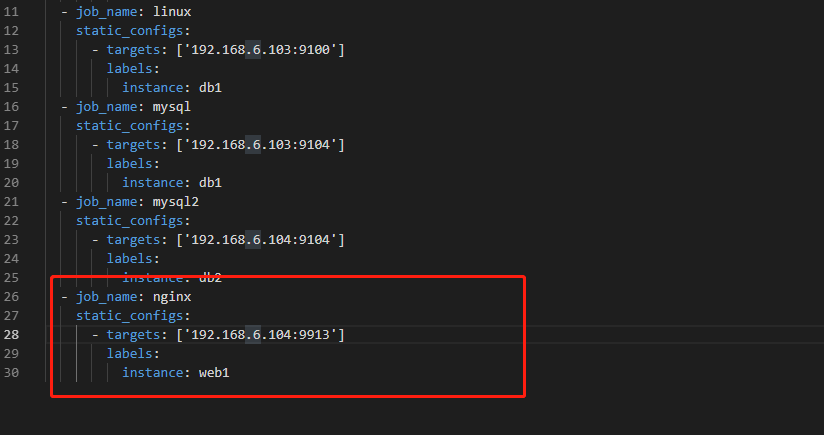
新增prometheus配置prometheus.yml如下:
主题下载地址:https://grafana.com/api/dashboards/2949/revisions/2/download
其他主题下载地址:https://grafana.com/api/dashboards/2949/revisions/2/download
下载好主题后进行主题导入即可。