Python第三方库之openpyxl(5)
气泡图
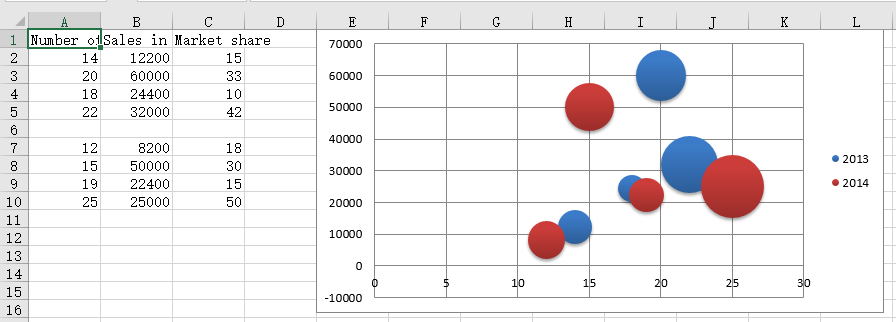
气泡图类似于散点图,但使用第三个维度来确定气泡的大小,图表可以包括多个项目
from openpyxl import Workbook
from openpyxl.chart import Series, Reference, BubbleChart

wb = Workbook()
ws = wb.active

rows = [
    ("Number of Products", "Sales in USD", "Market share"),
    (14, 12200, 15),
    (20, 60000, 33),
    (18, 24400, 10),
    (22, 32000, 42),
    (),
    (12, 8200, 18),
    (15, 50000, 30),
    (19, 22400, 15),
    (25, 25000, 50),
]

for row in rows:
    ws.append(row)

chart = BubbleChart()
chart.style = 18 # use a preset style

# add the first series of data
xvalues = Reference(ws, min_col=1, min_row=2, max_row=5)
yvalues = Reference(ws, min_col=2, min_row=2, max_row=5)
size = Reference(ws, min_col=3, min_row=2, max_row=5)
series = Series(values=yvalues, xvalues=xvalues, zvalues=size, title="2013")
chart.series.append(series)

# add the second
xvalues = Reference(ws, min_col=1, min_row=7, max_row=10)
yvalues = Reference(ws, min_col=2, min_row=7, max_row=10)
size = Reference(ws, min_col=3, min_row=7, max_row=10)
series = Series(values=yvalues, xvalues=xvalues, zvalues=size, title="2014")
chart.series.append(series)

# place the chart starting in cell E1
ws.add_chart(chart, "E1")
wb.save("bubble.xlsx")
运行结果