一、ElasticSearch
- ElasticSearch
- index
- type
- document
- Shard
- Primary
- Replica
- 9200/tcp
- RESTfull
- GET, PUT, POST, DELETE
环境:
192.168.0.8, 192.168.0.9, 192.168.0.10:ElasticSearch,内存大于2G
192.168.0.11:Logstash-agent,内存大于2G
192.168.0.12:Kibana
1、安装ElasticSearch,在三个节点都要安装
1、获取软件包
# wget https://artifacts.elastic.co/downloads/elasticsearch/elasticsearch-5.6.8.rpm
2、准备jdk环境:要求1.8以上
# yum install java-1.8.0-openjdk java-1.8.0-openjdk-devel -y
3、安装elasticsearch
# rpm -ivh elasticsearch-5.6.8.rpm
4、配置elasticsearch
# vim /etc/elasticsearch/elasticsearch.yml
cluster.name: dongfei-application
node.name: elk_node01  #主机名必须可以被解析
path.data: /myels/data
path.logs: /myels/logs
network.host: 192.168.0.8  #本节点IP
http.port: 9200
discovery.zen.ping.unicast.hosts: ["elk_node01", "elk_node02","elk_node03"]
discovery.zen.minimum_master_nodes: 2
5、创建目录
# mkdir -pv /myels/{data,logs} && chown elasticsearch.elasticsearch /myels/*
6、启动服务
# systemctl start elasticsearch
# systemctl enable elasticsearch
7、测试服务是否正常
# curl -XGET http://elk_node01:9200/
{
  "name" : "elk_node01",
  "cluster_name" : "dongfei-application",
  "cluster_uuid" : "_na_",
  "version" : {
    "number" : "5.6.8",
    "build_hash" : "688ecce",
    "build_date" : "2018-02-16T16:46:30.010Z",
    "build_snapshot" : false,
    "lucene_version" : "6.6.1"
  },
  "tagline" : "You Know, for Search"
}
2、ElasticSearch集群应用
- 集群健康状态查询
# curl -XGET http://elk_node01:9200/_cluster/health
# curl -XGET http://elk_node01:9200/_cluster/health?pretty
{
  "cluster_name" : "dongfei-application",
  "status" : "green",
  "timed_out" : false,
  "number_of_nodes" : 3,
  "number_of_data_nodes" : 3,
  "active_primary_shards" : 0,
  "active_shards" : 0,
  "relocating_shards" : 0,
  "initializing_shards" : 0,
  "unassigned_shards" : 0,
  "delayed_unassigned_shards" : 0,
  "number_of_pending_tasks" : 0,
  "number_of_in_flight_fetch" : 0,
  "task_max_waiting_in_queue_millis" : 0,
  "active_shards_percent_as_number" : 100.0
}
- 获取统计数据
# curl -XGET http://elk_node01:9200/_cluster/stats?pretty
- 获取节点的详细信息
# curl -XGET http://elk_node01:9200/_cat
# curl -XGET http://elk_node01:9200/_cat/nodes
192.168.0.8  4 65 0 0.00 0.01 0.05 mdi - elk_node01
192.168.0.9  4 65 0 0.00 0.01 0.05 mdi * elk_node02  #主节点
192.168.0.10 4 65 0 0.00 0.04 0.06 mdi - elk_node03
- 获取集群内有多少个分片或索引
# curl -XGET http://elk_node01:9200/_cat/shards
# curl -XGET http://elk_node01:9200/_cat/indices
- 创建索引
# curl -XPUT http://elk_node01:9200/myindex  #默认5个副本
# curl -XGET http://elk_node01:9200/_cat/indices
green open myindex PAP1A2A3TiWguV3-XVyO0g 5 1 0 0 1.5kb 810b
# curl -XGET http://elk_node01:9200/_cat/shards
myindex 3 p STARTED 0 162b 192.168.0.10 elk_node03
myindex 3 r STARTED 0 162b 192.168.0.8  elk_node01
myindex 4 r STARTED 0 162b 192.168.0.10 elk_node03
myindex 4 p STARTED 0 162b 192.168.0.8  elk_node01
myindex 1 p STARTED 0 162b 192.168.0.8  elk_node01
myindex 1 r STARTED 0 162b 192.168.0.9  elk_node02
myindex 2 r STARTED 0 162b 192.168.0.10 elk_node03
myindex 2 p STARTED 0 162b 192.168.0.9  elk_node02
myindex 0 p STARTED 0 162b 192.168.0.10 elk_node03
myindex 0 r STARTED 0 162b 192.168.0.9  elk_node02
- 创建文档
# curl -XPUT http://elk_node01:9200/myindex/students/1?pretty -d '{"name":"Ouyangfeng", "age":87, "major":"hamo gong"}'
# curl -XPUT http://elk_node01:9200/myindex/students/1?pretty -d '
{"name":"Ke Zhene", "age":69, "major":"jiang nan"}'
- 搜索文档
# curl -XGET http://elk_node01:9200/_search?q=nan
# curl -XGET http://elk_node01:9200/myindex/students/_search?q=gong
- 删除索引
# curl -XDELETE http://elk_node01:9200/myindex
3、创建、查询和删除
- 创建索引,类型和文档
# curl -XPUT elk_node01:9200/secindex/books/1?pretty -d '{"name":"elasticsearch in action","author":"tom"}'
# curl -XPUT elk_node01:9200/secindex/books/2?pretty -d '{"name":"elasticsearch in practise","author":"tom black"}'
# curl -XPUT elk_node01:9200/secindex/books/3?pretty -d '{"name":"docker in action","author":"jerry black"}'
# curl -XPUT elk_node01:9200/secindex/books/4?pretty -d '{"name":"tomcat in practise","author":"tomcat black"}'
# curl -XPUT elk_node01:9200/secindex/books/5?pretty -d '{"name":"nginx in practise","author":"tomcat black"}'
- 获取所有数据
# curl elk_node01:9200/secindex/_search?pretty
- 搜索
# curl elk_node01:9200/secindex/_search?q=action
# curl elk_node01:9200/secindex/_search?q=tom
# curl elk_node01:9200/secindex/_search?q=_all:tomcat
# curl elk_node01:9200/secindex/_search?q=author:tomcat
4、安装elasticsearch-head插件
1、获取安装包
# yum install git npm -y
# git clone https://github.com/mobz/elasticsearch-head.git
2、安装
# mv elasticsearch-head/ /usr/local/
# cd /usr/local/elasticsearch-head/
elasticsearch-head]# npm install
elasticsearch-head]# npm run start
二、Logstash
1、安装Logstash
1、准备jdk环境,要求1.8.0以上版本
# yum install java-1.8.0-openjdk-devel -y
2、获取logstash安装包,需要和ElasticSearch版本一致
# wget https://artifacts.elastic.co/downloads/logstash/logstash-5.6.8.rpm
3、安装配置logstash
# rpm -ivh logstash-5.6.8.rpm
# vim /etc/profile.d/logstash.sh
export PATH=/usr/share/logstash/bin/:$PATH
# . /etc/profile.d/logstash.sh
# logstash --help
2、调试
1、test1
# cd /etc/logstash/conf.d/
conf.d]# vim test1.conf
input {
    stdin{}
}
output {
    stdout{
    }
}
conf.d]# logstash -f test1.conf -t  #语法测试
conf.d]# logstash -f test1.conf
The stdin plugin is now waiting for input:
hello logstash!  #标准输入
2018-09-08T05:47:52.325Z logstash hello logstash!  #标准输出
2、test2
conf.d]# cp test1.conf test2.conf
conf.d]# vim test2.conf
input {
    stdin{}
}
output {
    stdout{
        codec => rubydebug
    }
}
conf.d]# logstash -f test2.conf
The stdin plugin is now waiting for input:
hello logstash!
{
      "@version" => "1",
          "host" => "logstash",
    "@timestamp" => 2018-09-08T05:51:08.469Z,
       "message" => "hello logstash!"
}
3、从文件读取数据
1、准备测试数据
# yum install httpd -y
# for i in {1..200}; do echo "Test Page $i." > /var/www/html/test$i.html; done
# vim /etc/httpd/conf/httpd.conf
    LogFormat "%{X-Forwarded-For}i %l %u %t "%r" %>s %b "%{Referer}i
" "%{User-Agent}i"" combined
# systemctl start httpd
# while true; do client=$[$RANDOM%254+1]; curl -s --header "X-Forwarded-For: 192.168.0.$client" http://192.168.0.11/test$client.html; sleep 1; done
# tail -f /var/log/httpd/access_log
2、配置数据源
conf.d]# vim test3.conf
input {
    file{
        start_position => "end"
        path => ["/var/log/httpd/access_log"]
    }
}
output {
    stdout{
        codec => rubydebug
    }
}
conf.d]# logstash -f test3.conf
4、日志切分插件配置
conf.d]# vim test4.conf
input {
    stdin {}
}
filter{
    grok {
        match => { "message" => "%{NUMBER:duration} %{IP:client}" }
    }
}
output {
    stdout {
        codec => rubydebug
    }
}
conf.d]# logstash -f test4.conf
The stdin plugin is now waiting for input:
32 192.168.0.222
{
      "@version" => "1",
          "host" => "logstash",
      "duration" => "32",
        "client" => "192.168.0.222",
    "@timestamp" => 2018-09-08T06:33:32.808Z,
       "message" => "32 192.168.0.222"
}
5、httpd日志切分
conf.d]# vim test5.conf
input {
    file{
        start_position => "end"
        path => ["/var/log/httpd/access_log"]
    }
}
filter {
    grok {
        match => { "message" => "%{HTTPD_COMBINEDLOG}" }
    }
}
output {
    stdout{
        codec => rubydebug
conf.d]# logstash -f test5.conf
{
        "request" => "/test40.html",
          "agent" => ""curl/7.29.0"",
           "auth" => "-",
          "ident" => "-",
           "verb" => "GET",
        "message" => "192.168.0.40 - - [08/Sep/2018:14:44:52 +0800] "GET /test40.html HTTP/1.1" 200 14 "-" "curl/7.29.0"",
           "path" => "/var/log/httpd/access_log",
       "referrer" => ""-"",
     "@timestamp" => 2018-09-08T06:44:53.230Z,
       "response" => "200",
          "bytes" => "14",
       "clientip" => "192.168.0.40",
       "@version" => "1",
           "host" => "logstash",
    "httpversion" => "1.1",
      "timestamp" => "08/Sep/2018:14:44:52 +0800"
}
6、过滤器插件
date插件和remove_field插件
conf.d]# vim test6.conf
input {
        file{
                start_position => "end"
                path => ["/var/log/httpd/access_log"]
        }
}
filter {
        grok {
                match => { "message" => "%{HTTPD_COMBINEDLOG}" }
                remove_field => "message"
        }
        date {
                match => ["timestamp","dd/MMM/YYYY:H:m:s Z"]
                remove_field => "timestamp"
        }
}
output {
        stdout{
                codec => rubydebug
        }
}
conf.d]# logstash -f test6.conf
{
        "request" => "/test28.html",
          "agent" => ""curl/7.29.0"",
           "auth" => "-",
          "ident" => "-",
           "verb" => "GET",
           "path" => "/var/log/httpd/access_log",
       "referrer" => ""-"",
     "@timestamp" => 2018-09-08T06:54:16.000Z,
       "response" => "200",
          "bytes" => "14",
       "clientip" => "28.20.0.100",
       "@version" => "1",
           "host" => "logstash",
    "httpversion" => "1.1"
}
模拟公网地址访问:
# while true; do client=$[$RANDOM%223+1]; curl -s --header "X-Forwarded-For: $client.20.0.100" http://192.168.0.11/test$client.html; sleep 1; done
7、Geoip插件
1、获取ip地址对应地区的数据库
# wget -O /etc/logstash/GeoLite2-City.tar.gz http://geolite.maxmind.com/download/geoip/database/GeoLite2-City.tar.gz
# cd /etc/logstash/
logstash]# tar xf GeoLite2-City.tar.gz
logstash]# mv GeoLite2-City_20180905/ geoip
2、配置Geoip插件
conf.d]# vim test7.conf
input {
        file{
                start_position => "end"
                path => ["/var/log/httpd/access_log"]
        }
}
filter {
        grok {
                match => { "message" => "%{HTTPD_COMBINEDLOG}" }
                remove_field => "message"
        }
        date {
                match => ["timestamp","dd/MMM/YYYY:H:m:s Z"]
                remove_field => "timestamp"
        }
        geoip {
                source => "clientip"
                target => "geoip"
                database => "/etc/logstash/geoip/GeoLite2-City.mmdb"
        }
}
output {
        stdout{
                codec => rubydebug
        }
}
conf.d]# logstash -f test7.conf
{
        "request" => "/test121.html",
          "agent" => ""curl/7.29.0"",
          "geoip" => {
                    "ip" => "121.20.0.100",
              "latitude" => 34.7725,
          "country_name" => "China",  #client_IP来自中国
         "country_code2" => "CN",
        "continent_code" => "AS",
         "country_code3" => "CN",
              "location" => {
            "lon" => 113.7266,
            "lat" => 34.7725
        },
             "longitude" => 113.7266
    },
           "auth" => "-",
          "ident" => "-",
           "verb" => "GET",
           "path" => "/var/log/httpd/access_log",
       "referrer" => ""-"",
     "@timestamp" => 2018-09-08T07:08:02.000Z,
       "response" => "200",
          "bytes" => "15",
       "clientip" => "121.20.0.100",
       "@version" => "1",
           "host" => "logstash",
    "httpversion" => "1.1"
}
8、配置输出到ElasticSearch
1、在logstash节点上配置
conf.d]# vim test8.conf
input {
        file{
                start_position => "end"
                path => ["/var/log/httpd/access_log"]
        }
}
filter {
        grok {
                match => { "message" => "%{HTTPD_COMBINEDLOG}" }
                remove_field => "message"
        }
        date {
                match => ["timestamp","dd/MMM/YYYY:H:m:s Z"]
                remove_field => "timestamp"
        }
        geoip {
                source => "clientip"
                target => "geoip"
                database => "/etc/logstash/geoip/GeoLite2-City.mmdb"
        }
}
output {
    elasticsearch {
        hosts => ["http://192.168.0.8:9200/","http://192.168.0.9:9200/","http://192.168.0.10:9200/"]
        index => "logstash-%{+YYYY.MM.dd}"
        document_type => "apache_logs"
    }
}
conf.d]# logstash -f test8.conf
2、在ElasticSearch任意节点查看数据是否同步
# curl -XGET elk_node01:9200/_cat/indices
green open logstash-2018.09.08 m1lAOt2fTdCffQ302Xn8zQ 5 1 184 0    1mb 512.6kb
# curl -XGET http://elk_node01:9200/logstash-2018.09.08/_search?q=clientip=1.20.0.100
三、Kibana
1、安装Kibana
1、获取安装包
# wget https://artifacts.elastic.co/downloads/kibana/kibana-5.6.8-x86_64.rpm
2、安装配置kibana
# rpm -ivh kibana-5.6.8-x86_64.rpm
# vim /etc/kibana/kibana.yml
server.port: 5601
server.host: "0.0.0.0"
server.name: "kibana"
elasticsearch.url: "http://192.168.0.9:9200"
# systemctl start kibana
访问:http://192.168.0.12:5601登录kibana的webGUI
3、配置kibana的webGUI
Management -- Create
Index pattern: logstash-*
Time Filter field name: @timestamp
2、kibana的简单使用
Discover:
- 搜索test99页面的访问:
request:test99 - 搜索来自亚洲的访问:
geoip.timezone:Asia - 搜索返回码为404的响应:
response:404 - 搜索返回码为200到302之间的响应
response:[200 TO 302] - 搜索特定的浏览器类型:
agent:chrome OR firefox OR safarl
Visualize:Create a visualization -- Pip -- logstash-* -- Split Slices -- 执行 --Save
Aggregation: Terms
Field: response.keyword
四、ELK架构
filebeat的安装
# wget https://artifacts.elastic.co/downloads/beats/filebeat/filebeat-5.6.8-x86_64.rpm
# rpm -ivh filebeat-5.6.8-x86_64.rpm
1、架构1(日志文件 -- filebeat -- ElasticSearch)
# vim /etc/filebeat/filebeat.yml
- input_type: log
  paths:
    - /var/log/httpd/access_log*
output.elasticsearch:
  hosts: ["192.168.0.8:9200","192.168.0.9:9200","192.168.0.10:9200"]
# systemctl start filebeat
# systemctl enable filebeat
2、架构2(日志文件 -- filebeat -- Logstash -- ElasticSearch)
1、filebeat配置
# vim /etc/filebeat/filebeat.yml
filebeat.prospectors:
- input_type: log
  paths:
    - /var/log/httpd/access_log*
output.logstash:
  hosts: ["192.168.0.11:5044"]
# systemctl start filebeat
2、Logstash配置
# vim /etc/logstash/conf.d/beat_els.conf
input {
        beats {
                port => "5044"
        }
}
filter {
        grok {
                match => { "message" => "%{HTTPD_COMBINEDLOG}" }
                remove_field => "message"
        }
        date {
                match => ["timestamp","dd/MMM/YYYY:H:m:s Z"]
                remove_field => "timestamp"
        }
        geoip {
                source => "clientip"
                target => "geoip"
                database => "/etc/logstash/geoip/GeoLite2-City.mmdb"
        }
}
output {
        elasticsearch {
                hosts => ["http://192.168.0.8:9200/","http://192.168.0.9:9200/","http://192.168.0.10:9200/"]
                index => "logstash-%{+YYYY.MM.dd}"
                document_type => "apache_logs"
        }
}
# systemctl start logstash
# systemctl enable logstash
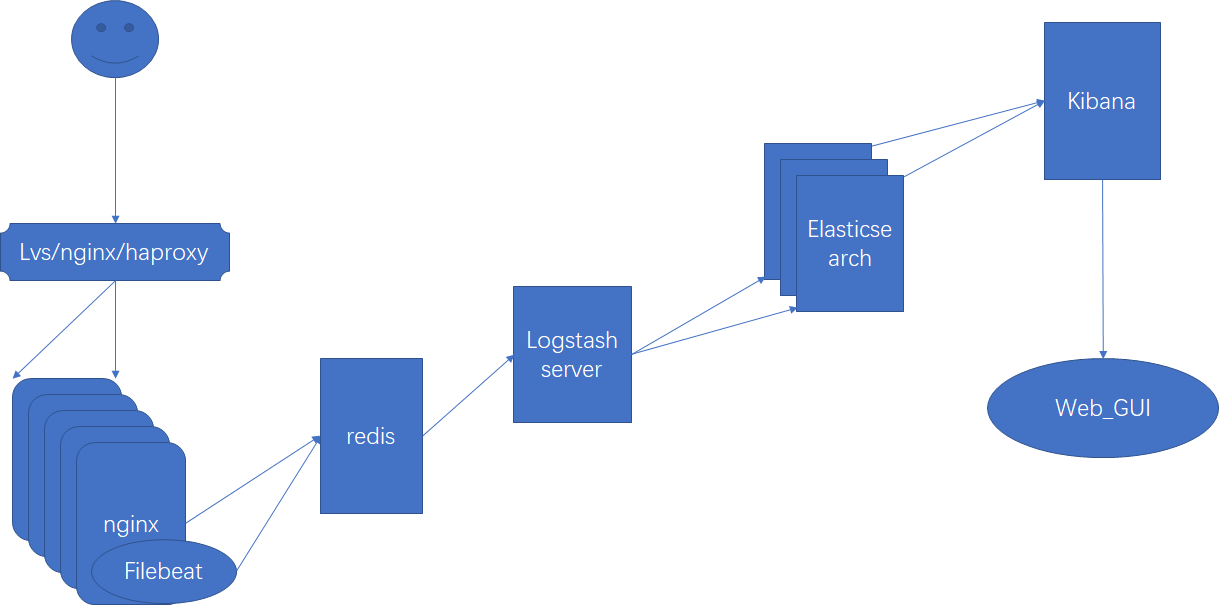
3、架构3(日志文件 -- filebeat -- redis -- Logstash -- ElasticSearch)
1、filebeat配置
# vim /etc/filebeat/filebeat.yml
output.redis:
  enabled: true
  hosts: ["192.168.0.11:6379"]
  port: 6379
  key: filebeat
  password: dongfei.tech
  db: 0
  datatype: list
  worker: 1
# systemctl start filebeat
2、Redis配置
# yum install redis
# vim /etc/redis.conf
bind 0.0.0.0
requirepass dongfei.tech
# systemctl start redis
# systemctl enable redis
[root@logstash ~]# redis-cli
127.0.0.1:6379> AUTH dongfei.tech
127.0.0.1:6379> KEYS *
1) "filebeat"
3、Logstash配置
# vim /etc/logstash/conf.d/redis_els.conf
input {
        redis {
                data_type => "list"
                db => 0
                host => "192.168.0.11"
                port => 6379
                key => "filebeat"
                password => "dongfei.tech"
        }
}
filter {
        grok {
                match => { "message" => "%{HTTPD_COMBINEDLOG}" }
                remove_field => "message"
        }
        date {
                match => ["timestamp","dd/MMM/YYYY:H:m:s Z"]
                remove_field => "timestamp"
        }
        geoip {
                source => "clientip"
                target => "geoip"
                database => "/etc/logstash/geoip/GeoLite2-City.mmdb"
        }
}
output {
        elasticsearch {
                hosts => ["http://192.168.0.8:9200/","http://192.168.0.9:9200/","http://192.168.0.10:9200/"]
                index => "logstash-%{+YYYY.MM.dd}"
                document_type => "apache_logs"
        }
}
# systemctl start logstash
感谢阅读!