1. Linear Regression: Predict life expectancy from birth rate
1.1 Problem
-
描述问题:
I recently came across the visualization of the relationship between birth rates and life expectancies of different countries around the world and found that fascinating. Basically, it looks like the more children you have, the younger you are going to die!
-
可视化部分数据源,得出基本有线性关系的大概结论
You can play the visualization created by Google based on the data collected by the World Bank here.
-
收集数据,制作Dataset
For this problem, we will be using a subset of the World Development Indicators dataset collected by the World Bank. For simplicity, we will be using data from the year 2010 only. You can download the data from class’s GitHub folder here.
1.2 Dataset Description
Name: Birth rate - life expectancy in 2010
X = birth rate. Type: float
Y = life expectancy. Type: foat.
Number of datapoints: 190
1.3 Approach
- First, assume that the relationship between the birth rate and the life expectancy is linear, which means that we can find w and b such that Y = wX + b.
- To find w and b (in this case, they are both scalars), we will use backpropagation through a one layer neural network. For the loss function, we will be using mean squared error. After each epoch, we measure the mean squared difference between the actual value Ys and the predicted values of Ys.
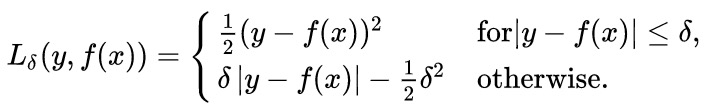
1.4 Control flow: Huber loss
-
Looking at the graph, we see that several outliers on the central bottom are outliers: they have low birth rate but also low life expectancy. Those outliers pull the fitted line towards them, making the model perform worse. One way to deal with outliers is to use Huber loss. Intuitively, squared loss has the disadvantage of giving too much weights to outliers (you square the difference - the larger the difference, the larger its square). Huber loss was designed to give less weight to outliers. Wikipedia has a pretty good article on it. Below is the Huber loss function:
-
To implement this in TensorFlow, we might be tempted to use something Pythonic such as:
if tf.abs(Y_predicted - Y) <= delta:
     # do something
However, this approach would only work if TensorFlow's eager execution were enabled, which we will learn about in the next lecture. If we use the current version, TensorFlow would soon notify us that “TypeError: Using a
tf.Tensoras a Pythonboolis not allowed.” We will need to use control flow ops defined by TensorFlow. For the full list of those ops, please visit the official documentation.Control Flow Ops tf.count_up_to, tf.cond, tf.case, tf.while_loop, tf.group ... Comparison Ops tf.equal, tf.not_equal, tf.less, tf.greater, tf.where, ... Logical Ops tf.logical_and, tf.logical_not, tf.logical_or, tf.logical_xor Debugging Ops tf.is_finite, tf.is_inf, tf.is_nan, tf.Assert, tf.Print, ... To implement Huber loss, we can use either tf.greater, tf.less, or tf.cond. We will be using tf.cond since it’s the most general. Other ops’ usage is pretty similar.
tf.cond( pred, true_fn=None, false_fn=None, ...) # # def huber_loss(labels, predictions, delta=14.0): residual = tf.abs(labels - predictions) def f1(): return 0.5 * tf.square(residual) def f2(): return delta * residual - 0.5 * tf.square(delta) return tf.cond(residual < delta, f1, f2) -
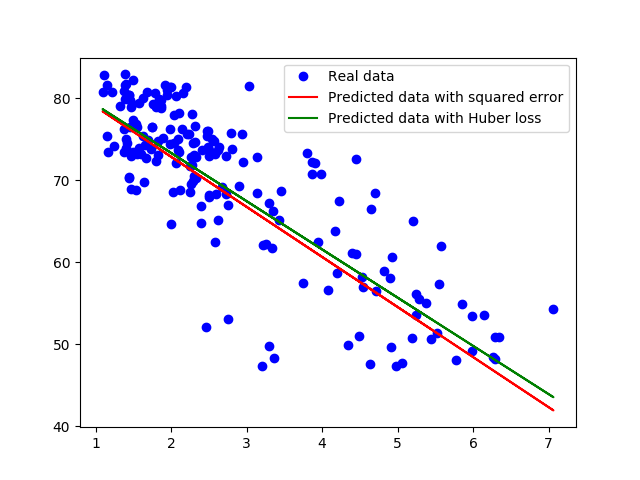
The graph compares the fitted line obtained by squared loss and Huber loss.
-
Which model performs better? Ah, we should have had a test set.