1.需要安装许多库。(建议安装anaconda在其Anaconda prompt安装以下库)
需要升级Anaconda prompt

库list as follows;
安装 wxpy: pip install wxpy
安装 PIL: pip install pillow
安装 pyecharts:pip install pyecharts
安装 Itchat: pip install itchat
安装 Jieba: pip install jieba
安装 Pandas:pip install Pandas
安装 Numpy:pip install Numpy
安装地图数据包:pip install echarts-china-provinces-pypkg
pip install echarts-countries-pypkg
2.运行代码:
#导入模块
from wxpy import *
#初始化机器人,选择缓存模式(扫码)登录
bot = Bot(cache_path=True)
#获取我的所有微信好友信息
friend_all = bot.friends()
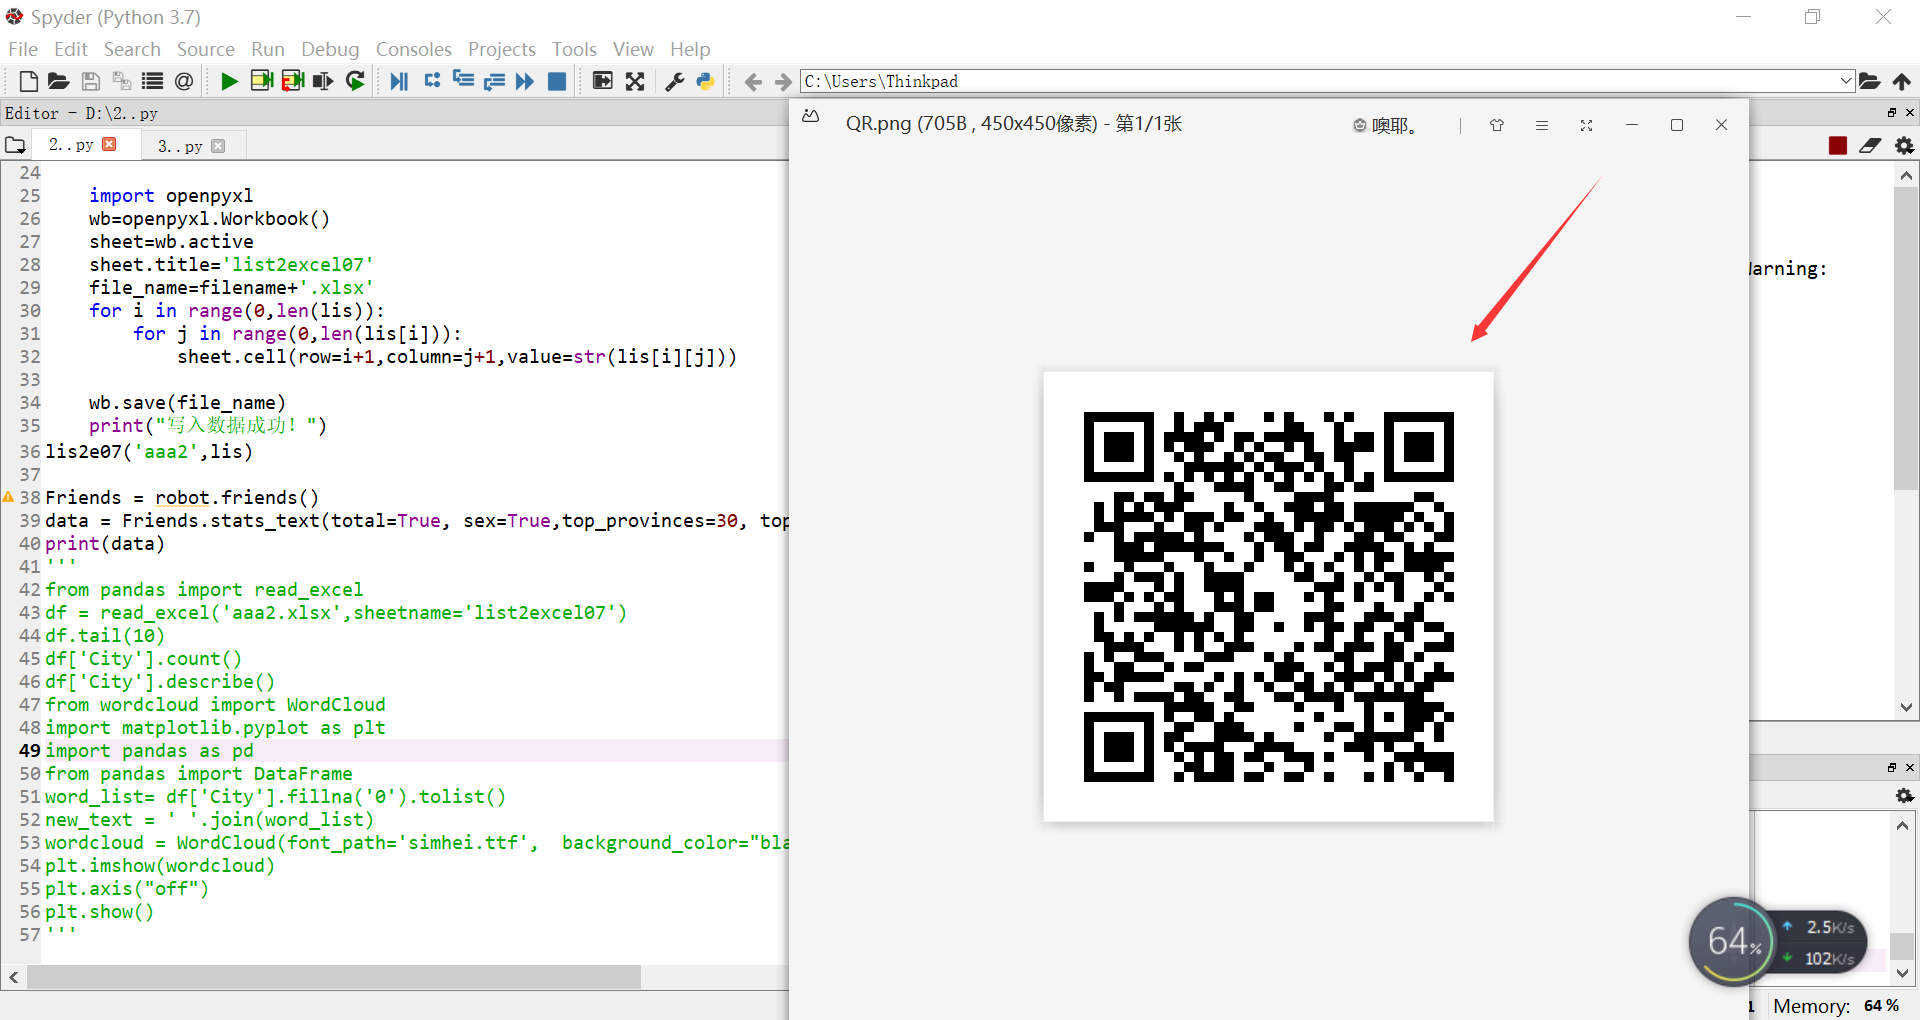
结果:

出现一个二维码,扫码登录。
3.代码来了
# -*- coding: utf-8 -*-
"""
Created on Wed Jun  5 22:59:23 2019

@author: Thinkpad
"""

from wxpy import *
bot = Bot(cache_path=True)
friend_all = bot.friends()

lis=[]
for a_friend in friend_all:
    NickName = a_friend.raw.get('NickName',None)
    Sex = {1:"男",2:"女",0:"其他"}.get(a_friend.raw.get('Sex',None),None)
    City = a_friend.raw.get('City',None)
    Province = a_friend.raw.get('Province',None)
    Signature = a_friend.raw.get('Signature',None)
    HeadImgUrl = a_friend.raw.get('HeadImgUrl',None)
    HeadFlag     = a_friend.raw.get('headFlag',None)
    list_0=[NickName,Sex,City,Province,Signature,HeadImgUrl,HeadFlag]
    lis.append(list_0)
def lis2e07(filename,lis):

    import openpyxl
    wb=openpyxl.Workbook()
    sheet=wb.active
    sheet.title='list2excel07'
    file_name=filename+'.xlsx'
    for i in range(0,len(lis)):
        for j in range(0,len(lis[i])):
            sheet.cell(row=i+1,column=j+1,value=str(lis[i][j]))

    wb.save(file_name)
    print("写入数据成功!")
lis2e07('aaa2',lis)

Friends = robot.friends()
data = Friends.stats_text(total=True, sex=True,top_provinces=30, top_cities=500)
print(data)
这是一部分,这时已经生成aaa2.xlsx文件

4.新建一个窗口;输入代码:
# -*- coding: utf-8 -*-
"""
Created on Thu Jun  6 00:31:42 2019

@author: Thinkpad
"""

from pandas import read_excel
df = read_excel('aaa2.xlsx',sheetname='list2excel07')
df.tail(10)
df['City'].count()
df['City'].describe()
from wordcloud import WordCloud
import matplotlib.pyplot as plt
import pandas as pd
from pandas import DataFrame
word_list= df['City'].fillna('0').tolist()
new_text = ' '.join(word_list)
wordcloud = WordCloud(font_path='simhei.ttf',  background_color="black").generate(new_text)
plt.imshow(wordcloud)
plt.axis("off")
plt.show()
结果如下:

写的简单望谅解。
参考文献:点击我