matplotlib教程学习笔记
cycler
在教程开始之前,我们需要了解cycler模块
from __future__ import print_function
from cycler import cycler
color_cycler = cycler(color=["r", "g", "b"])  #通过cycler 可以创建cycler对象
color_cycler
| 'color' |
|---|
| 'r' |
| 'g' |
| 'b' |
len(color_cycler) #获取长度
3
color_cycler.keys #获取键
{'color'}
from __future__ import print_function
for v in color_cycler:
    print(v)
{'color': 'r'}
{'color': 'g'}
{'color': 'b'}
cycler(ec=color_cycler) #可以用已有的cycler对象作为cycler的参数,并返回一个相同的对象
| 'ec' |
|---|
| 'r' |
| 'g' |
| 'b' |
for i in range(5):  #看到了这么做会报错,显然的
    print(color_cycler[i])
---------------------------------------------------------------------------

ValueError                                Traceback (most recent call last)

<ipython-input-9-b6d40aff26d1> in <module>
      1 for i in range(5):  #看到了这么做会报错,显然的
----> 2     print(color_cycler[i])


C:Analibsite-packagescycler.py in __getitem__(self, key)
    221                                 for k, v in six.iteritems(trans)))
    222         else:
--> 223             raise ValueError("Can only use slices with Cycler.__getitem__")
    224
    225     def __iter__(self):


ValueError: Can only use slices with Cycler.__getitem__
cc = color_cycler()
for j, c in zip(range(5), cc): #通过这种方式,我们实际上可以获得一个无限的序列
    print(j, c)
0 {'color': 'r'}
1 {'color': 'g'}
2 {'color': 'b'}
3 {'color': 'r'}
4 {'color': 'g'}
#俩个cycler对象的和会以一种“内积”的方式结合
lw_cycler = cycler(lw=range(1, 4)) #注意len(lw_cycler)==3
wc = lw_cycler + color_cycler #如果二者长度不同,是无法相加的
print(len(wc))
print(wc.keys)
for s in wc:
    print(s)
3
{'lw', 'color'}
{'lw': 1, 'color': 'r'}
{'lw': 2, 'color': 'g'}
{'lw': 3, 'color': 'b'}
#和是可交换的
lw_c = lw_cycler + color_cycler
c_lw = color_cycler + lw_cycler
for j, (a, b) in enumerate(zip(lw_c, c_lw)):
    print("({j}) A: {A!r} B:{B!r}".format(
        j=j, A=a, B=b
    ))
(0) A: {'lw': 1, 'color': 'r'} B:{'color': 'r', 'lw': 1}
(1) A: {'lw': 2, 'color': 'g'} B:{'color': 'g', 'lw': 2}
(2) A: {'lw': 3, 'color': 'b'} B:{'color': 'b', 'lw': 3}
#通过一次性传入多个长度相等的参数,也可以做到类似和的操作
wc = cycler(c=['r', 'g', 'b'], lw=range(1,4))
for s in wc:
    print(s)
{'c': 'r', 'lw': 1}
{'c': 'g', 'lw': 2}
{'c': 'b', 'lw': 3}
# 乘法 类似“外积”的一种定义 就是每个都来一下
m_cycler = cycler(marker=['s', 'o'])
m_c = m_cycler * color_cycler
print(len(m_c))
print(m_c.keys)
for s in m_c:
    print(s)
6
{'marker', 'color'}
{'marker': 's', 'color': 'r'}
{'marker': 's', 'color': 'g'}
{'marker': 's', 'color': 'b'}
{'marker': 'o', 'color': 'r'}
{'marker': 'o', 'color': 'g'}
{'marker': 'o', 'color': 'b'}
#乘法交换后二者不一定一致
c_m = color_cycler * m_cycler
for j, (a, b) in enumerate(zip(c_m, m_c)):
    print("({j}) A: {A!r} B: {B!r}".format(
        j=j, A=a, B=b
    ))
(0) A: {'color': 'r', 'marker': 's'} B: {'marker': 's', 'color': 'r'}
(1) A: {'color': 'r', 'marker': 'o'} B: {'marker': 's', 'color': 'g'}
(2) A: {'color': 'g', 'marker': 's'} B: {'marker': 's', 'color': 'b'}
(3) A: {'color': 'g', 'marker': 'o'} B: {'marker': 'o', 'color': 'r'}
(4) A: {'color': 'b', 'marker': 's'} B: {'marker': 'o', 'color': 'g'}
(5) A: {'color': 'b', 'marker': 'o'} B: {'marker': 'o', 'color': 'b'}
#整数数乘 好像就是简单地扩大几倍
color_cycler * 2 # == 2 * color_cycler
| 'color' |
|---|
| 'r' |
| 'g' |
| 'b' |
| 'r' |
| 'g' |
| 'b' |
color_cycler.concat(color_cycler) #在后面续上? concat
| 'color' |
|---|
| 'r' |
| 'g' |
| 'b' |
| 'r' |
| 'g' |
| 'b' |
color_cycler.concat(m_cycler) #看来concat必须key一致
---------------------------------------------------------------------------

ValueError                                Traceback (most recent call last)

<ipython-input-18-c4ba2b85481a> in <module>
----> 1 color_cycler.concat(m_cycler)  #看来concat必须key一致


C:Analibsite-packagescycler.py in concat(self, other)
    423             The concatenated `Cycler`
    424         """
--> 425         return concat(self, other)
    426
    427


C:Analibsite-packagescycler.py in concat(left, right)
    459                                just_one=left.keys ^ right.keys)
    460
--> 461         raise ValueError(msg)
    462
    463     _l = left.by_key()


ValueError: Keys do not match:
	Intersection: set()
	Disjoint: {'marker', 'color'}
# 切片操作
color_cycler[::-1] #倒序
| 'color' |
|---|
| 'b' |
| 'g' |
| 'r' |
color_cycler[:2]
| 'color' |
|---|
| 'r' |
| 'g' |
color_cycler[1:]
| 'color' |
|---|
| 'g' |
| 'b' |
#我们可以通过by_key方法来检视,感觉就是获得某个键及其值啊
c_m.by_key()
{'marker': ['s', 'o', 's', 'o', 's', 'o'],
 'color': ['r', 'r', 'g', 'g', 'b', 'b']}
#这个字典可以用作创建新的cycler的蓝本
bk = c_m.by_key()
bk['color'] = ['green'] * len(c_m)
cycler(**bk)
| 'color' | 'marker' |
|---|---|
| 'green' | 's' |
| 'green' | 'o' |
| 'green' | 's' |
| 'green' | 'o' |
| 'green' | 's' |
| 'green' | 'o' |
一些例子
from itertools import cycle
import matplotlib.pyplot as plt
from cycler import cycler
import numpy as np
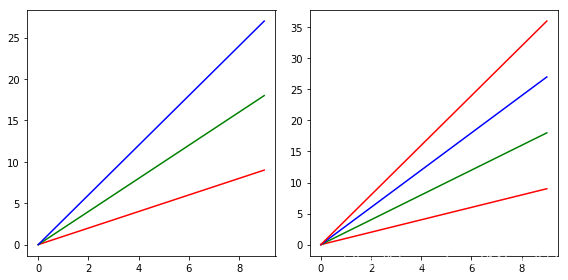
fig, (ax1, ax2) = plt.subplots(1, 2, tight_layout=True,
                              figsize=(8, 4))
x = np.arange(10)
color_cycler = cycler(c=["r", "g", "b"])
for i, sty in enumerate(color_cycler):
    ax1.plot(x, x*(i+1), **sty)

for i, sty in zip(range(1, 5), cycle(color_cycler)):
    ax2.plot(x, x*i, **sty)
C:Analibsite-packagesmatplotlibfigure.py:2366: UserWarning: This figure includes Axes that are not compatible with tight_layout, so results might be incorrect.
  warnings.warn("This figure includes Axes that are not compatible "
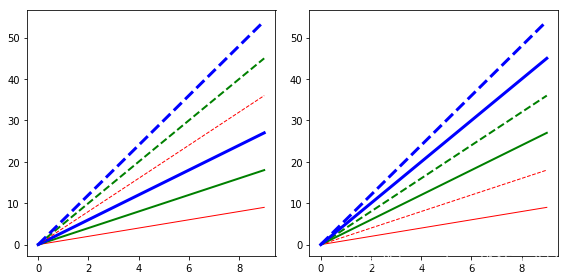
这个例子利用了乘法
fig, (ax1, ax2) = plt.subplots(1, 2, tight_layout=True,
                               figsize=(8, 4))
x = np.arange(10)

color_cycle = cycler(c=['r', 'g', 'b'])
ls_cycle = cycler('ls', ['-', '--'])
lw_cycle = cycler('lw', range(1, 4))

sty_cycle = ls_cycle * (color_cycle + lw_cycle)

for i, sty in enumerate(sty_cycle):
   ax1.plot(x, x*(i+1), **sty)

sty_cycle = (color_cycle + lw_cycle) * ls_cycle

for i, sty in enumerate(sty_cycle):
   ax2.plot(x, x*(i+1), **sty)
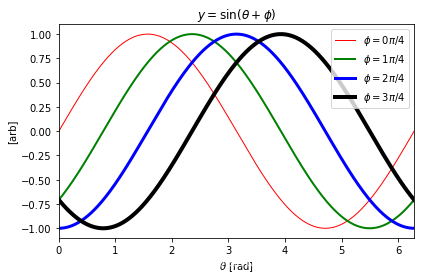
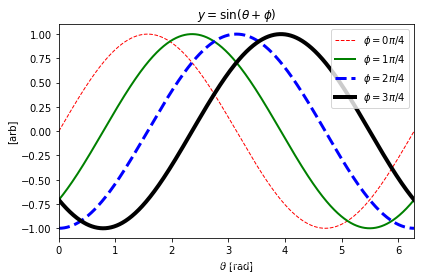
我们总是希望给与不同的线条以不同的方案(变着花样玩)
fig, ax = plt.subplots(tight_layout=True)
x = np.linspace(0, 2*np.pi, 1024)

for i, (lw, c) in enumerate(zip(range(4), ['r', 'g', 'b', 'k'])):
   ax.plot(x, np.sin(x - i * np.pi / 4),
           label=r'$phi = {{{0}}} pi / 4$'.format(i),
           lw=lw + 1, #lw线宽
           c=c)

ax.set_xlim([0, 2*np.pi])
ax.set_title(r'$y=sin(	heta + phi)$')
ax.set_ylabel(r'[arb]')
ax.set_xlabel(r'$	heta$ [rad]')

ax.legend(loc=0);
更为复杂的
fig, ax = plt.subplots(tight_layout=True)
x = np.linspace(0, 2*np.pi, 1024)

for i, (lw, c) in enumerate(zip(range(4), ['r', 'g', 'b', 'k'])):
   if i % 2:
       ls = '-'
   else:
       ls = '--'
   ax.plot(x, np.sin(x - i * np.pi / 4),
           label=r'$phi = {{{0}}} pi / 4$'.format(i),
           lw=lw + 1,
           c=c,
           ls=ls)

ax.set_xlim([0, 2*np.pi])
ax.set_title(r'$y=sin(	heta + phi)$')
ax.set_ylabel(r'[arb]')
ax.set_xlabel(r'$	heta$ [rad]')

ax.legend(loc=0);
教程
import matplotlib.pyplot as plt
import numpy as np
from cycler import cycler
我们先生成一些样本数据
x = np.linspace(0, 2 * np.pi, 50)
offsets = np.linspace(0, 2 * np.pi, 4, endpoint=False)
yy = np.transpose([np.sin(x + phi) for phi in offsets])
yy.shape
(50, 4)
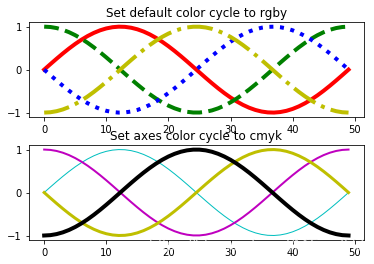
prop_cycle: the property cycle, 控制未来绘图时候的一些style
default_cycler = (cycler(color=['r', 'g', 'b', 'y']) +
                  cycler(linestyle=['-', '--', ':', '-.']))

plt.rc('lines', linewidth=4)  #设置未来的lines的style
plt.rc('axes', prop_cycle=default_cycler) #设置未来的axes的style
通过matplotlib.axes.Axes.set_prop_cycle可以来设置相应prop_cycle
custom_cycler = (cycler(color=['c', 'm', 'y', 'k']) +
                 cycler(lw=[1, 2, 3, 4]))

fig, (ax0, ax1) = plt.subplots(nrows=2)
ax0.plot(yy) #default_cycler
ax0.set_title('Set default color cycle to rgby')
ax1.set_prop_cycle(custom_cycler)
ax1.plot(yy)
ax1.set_title('Set axes color cycle to cmyk')

# Add a bit more space between the two plots.
fig.subplots_adjust(hspace=0.3)
plt.show()