node.exe调试JavaScript代码
目的:
Console.log可以打印一些信息,光有log还不够,当程序出现问题时通过log可以定位到错误位置,但是当我们想查看错误现场的变量时,log就无能为力了,一般情况下我们不会把所有的变量都打印出来。此时就需要断点的功能了,在程序里边打上断点,直接定位到错误位置,分析错误现场确认错误原因。
三种模式:
nodejs内部提供一个debug机制,可以让程序进入debug模式,供开发者一步一步分析代码发现问题。
共有3中启动参数可以让程序进入debug模式
node debug app.js
node --debug app.js
node --debug -brk app.js
3种模式在调试形式上有一定区别。
1.node debug app.js
1).这种方式启动程序,程序会进入debug模式,并运行到启动文件的第1行就停止,等待开发者下发往下走的命令
2).这种方式启动程序,直接在当前cmd中进入调试模式
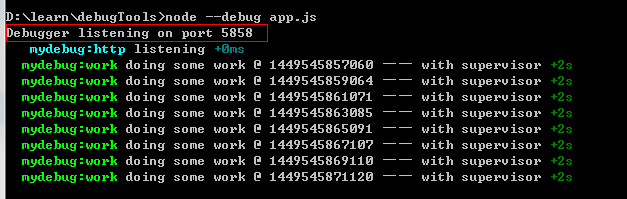
2.node --debug app.js
1).这种方式启动程序,程序会进入debug模式,并运行完所有代码。这种启动方式往往用于程序启动的过程中不需要调试,通过触发时间进入回调函数的情况,比如在某个http请求中打上断点,等待客户端访问后进入断点
2).这种方式启动程序,会开启一个TCP的端口监听,在本cmd中不进入调试模式,需要另外开启终端用node debug 命令连接调试端口
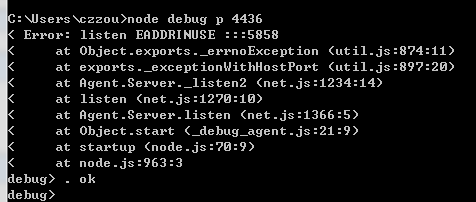
命令为 node debug localhost debug端口
或者 node debug p node进程id
3.node --debug-brk app.js
1).这种方式启动程序,程序会进入debug模式,但是不会运行代码,直到有一个终端连接到了debug端口,才开始执行代码,并在第1行进入断点
2).这种方式启动程序,会开启一个TCP的端口监听,在本cmd中不进入调试模式,需要另外开启终端用node debug 命令连接调试端口
进入debug模式后,可以通过一些命令来设置断点、取消断点以及控制程序执行流程
常用命令:
1.流程控制相关
- cont, c - Continue execution
- next, n - Step next
- step, s - Step in
- out, o - Step out
- pause - Pause running code (like pause button in Developer Tools)
2. 断点设置取消相关
- setBreakpoint(), sb() - Set breakpoint on current line
- setBreakpoint(line), sb(line) - Set breakpoint on specific line
- setBreakpoint('fn()'), sb(...) - Set breakpoint on a first statement in functions body
- setBreakpoint('script.js', 1), sb(...) - Set breakpoint on first line of script.js
- clearBreakpoint('script.js', 1), cb(...) - Clear breakpoint in script.js on line 1
3. 变量查看相关
- backtrace, bt - Print backtrace of current execution frame
- list(5) - List scripts source code with 5 line context (5 lines before and after)
- watch(expr) - Add expression to watch list
- unwatch(expr) - Remove expression from watch list
- watchers - List all watchers and their values (automatically listed on each breakpoint)
- repl - Open debugger's repl for evaluation in debugging script's context
repl模式下可以输入变量名查看变量内容
举例:
1. node debug
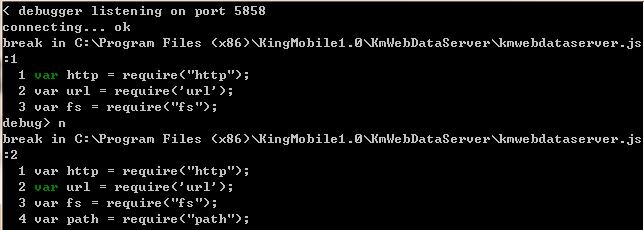
从第一行代码开始进入断点,命令n进入下一行
2. node --debug
cmd1 开启调试端口
cmd2 连接调试端口

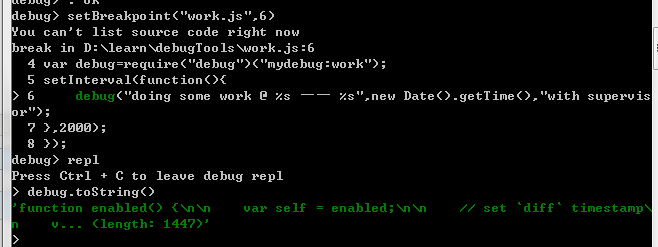
设置断点,取消断点
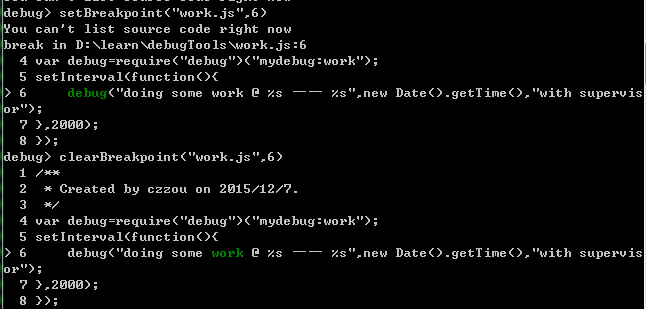
cmd1 过了一分钟才继续打印

用进程id的方式连接调试模块

上图可以看到pid为4436
repl模式
参考资料:
http://www.cnblogs.com/tzyy/p/5028348.html
http://www.cnblogs.com/dolphinX/archive/2013/12/22/3485345.html