library('ggplot2')
prices <- read.csv('G:\dataguru\ML_for_Hackers\ML_for_Hackers-master\08-PCA\data\stock_prices.csv',stringsAsFactors = FALSE)
library('lubridate')
#把日期列转成日期对象
prices <- transform(prices, Date = ymd(Date))
#prices中的数据只有三列,日期,股票名,价格
library('reshape')
#转下格式,矩阵中,每一天是一行,一行中包含了所有股票当天的价格,Date~Stock,行方向是Date列,列方向是Stock列
date.stock.matrix <- cast(prices, Date ~ Stock, value = 'Close')
#以上矩阵有缺失数据,先去prices删除缺失数据,然后重新生成矩阵
prices <- subset(prices, Date != ymd('2002-02-01'))
prices <- subset(prices, Stock != 'DDR')
date.stock.matrix <- cast(prices, Date ~ Stock, value = 'Close')
#做出相关性矩阵
cor.matrix <- cor(date.stock.matrix[, 2:ncol(date.stock.matrix)])
#转成一个数值向量
correlations <- as.numeric(cor.matrix)
#画图
ggplot(data.frame(Correlation = correlations),aes(x = Correlation, fill = 1)) +geom_density() + theme(legend.position = 'none')
#从图上看出,大部分相关性是正数,因此适合使用PCA

pca <- princomp(date.stock.matrix[, 2:ncol(date.stock.matrix)])
#看下pca第一主成分的载荷,并画图
principal.component <- pca$loadings[, 1]
loadings <- as.numeric(principal.component)
ggplot(data.frame(Loading = loadings), aes(x = Loading, fill = 1)) + geom_density() + theme(legend.position = 'none')

#从图上看,几乎全是负数
#预测一下
market.index <- predict(pca)[, 1]
#加载道琼斯指数
dji.prices <- read.csv('G:\dataguru\ML_for_Hackers\ML_for_Hackers-master\08-PCA\data\DJI.csv', stringsAsFactors = FALSE)
#把日期列转化一下
dji.prices <- transform(dji.prices, Date = ymd(Date))
#只拿一个子集看一下
dji.prices <- subset(dji.prices, Date > ymd('2001-12-31'))
dji.prices <- subset(dji.prices, Date != ymd('2002-02-01'))
#道琼斯数据集中数据好多,只拿收盘价和日期来看一下
dji <- with(dji.prices, rev(Close))
dates <- with(dji.prices, rev(Date))
#弄个数据集,MarketIndex是预测的
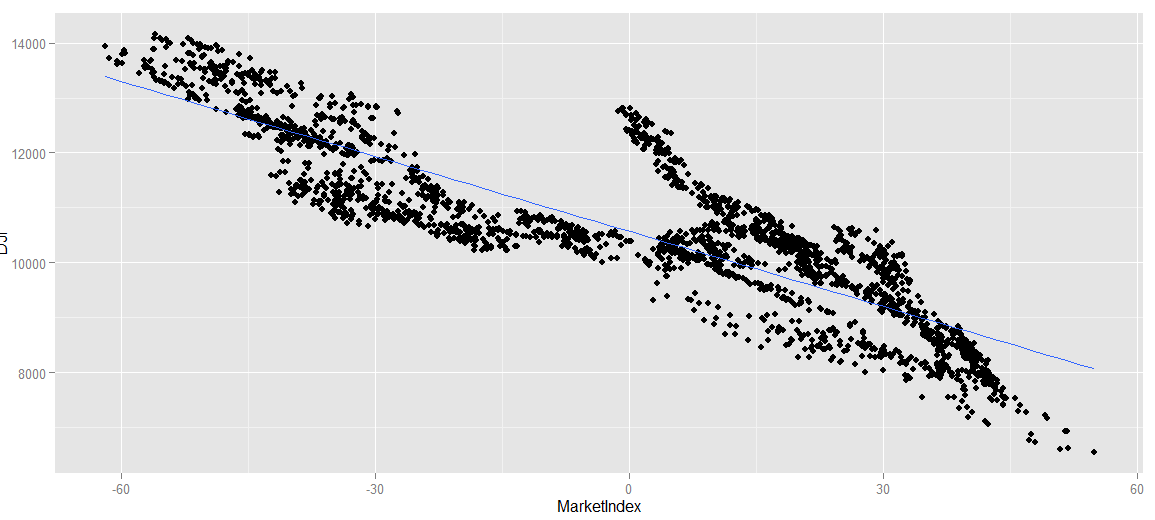
comparison <- data.frame(Date = dates, MarketIndex = market.index,DJI = dji)
ggplot(comparison, aes(x = MarketIndex, y = DJI)) + geom_point() + geom_smooth(method = 'lm', se = FALSE)
#从图上看,预测值和DJI指数负相关
comparison <- transform(comparison, MarketIndex = -1 * MarketIndex)
ggplot(comparison, aes(x = MarketIndex, y = DJI)) + geom_point() + geom_smooth(method = 'lm', se = FALSE)

#comparison有三列,日期,预测值,道琼斯指数
alt.comparison <- melt(comparison, id.vars = 'Date')
#melt后alt.comparison有三列,日期,类别(预测/道琼斯),价格
names(alt.comparison) <- c('Date', 'Index', 'Price')
ggplot(alt.comparison,aes(x = Date, y = Price, group = Index, color = Index)) + geom_point() + geom_line()
#图上看,预测值太低了,没法比对

#用scale把两部分数值放在同一刻度下
comparison <- transform(comparison, MarketIndex = scale(MarketIndex))
comparison <- transform(comparison, DJI = scale(DJI))
#重新melt
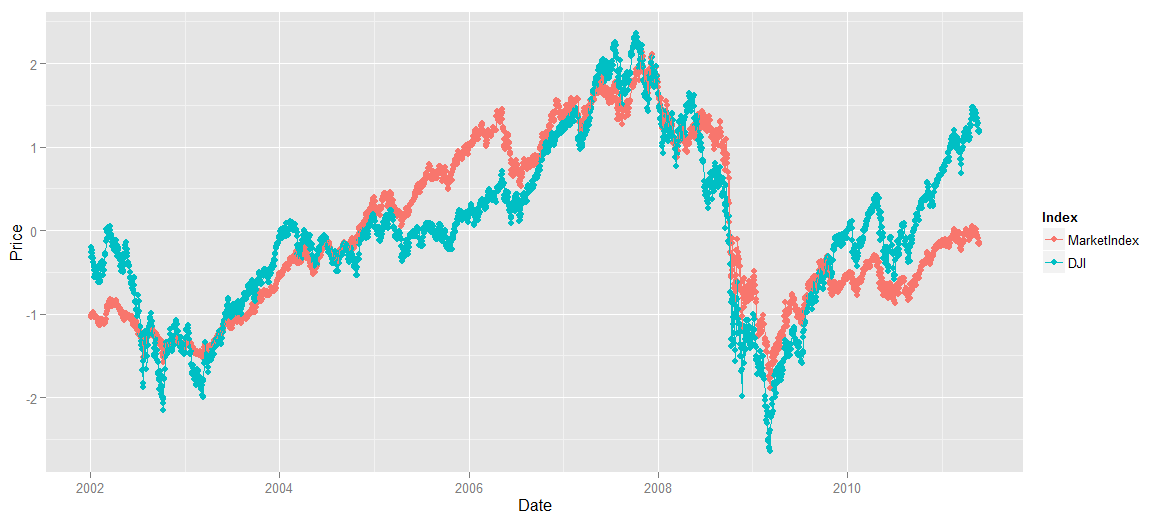
alt.comparison <- melt(comparison, id.vars = 'Date')
names(alt.comparison) <- c('Date', 'Index', 'Price')
#重新画图
ggplot(alt.comparison, aes(x = Date, y = Price, group = Index, color = Index)) + geom_point() + geom_line()