最近在看这本书看到Chapter 3.Classification,是关于mnist数据集的分类,里面有个代码是
from sklearn.datasets import fetch_mldata
mnist = fetch_mldata('MNIST original')
mnist
我十分郁闷,因为这个根本加载不出来-_-||,报了个OSError,改了data_home之后也有error,然后我按照网上的方法改data_home也没用,弄了很久最后决定自己弄这个数据集出来(气死了)
百度搜索mnist第一个出来的就是http://yann.lecun.com/exdb/mnist/
很多人点进去就头大,看到四个可下载的文件不知道怎么用(包括我),不过为了解决这个问题我就耐心读了下页面(心情简单)


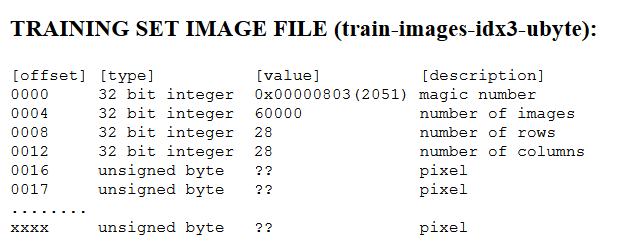
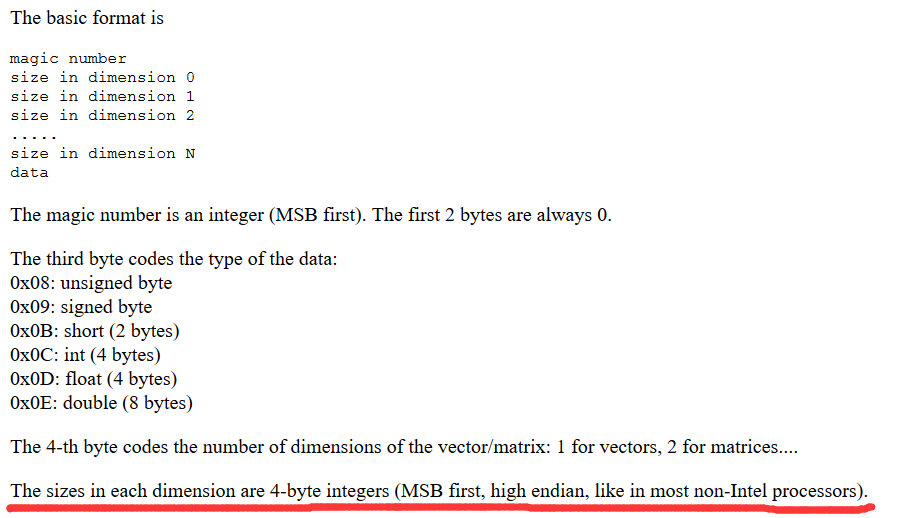
这两张图要放一起看,特别是划红线的部分,我们可以确定一下几个事实:
- 每个dimension是 4-byte Integers,对应到struct模块里面的fmt格式就是'I'
- high endian也就是大端法读进来,至于什么是大端法我想大家可以去wiki看看ヽ( ̄▽ ̄)ノ
- 右图的dimension 0就是左边的magic number,接下里的dimension 1就是number of images,如此类推应该就会看了吧emmmmm
补充个链接:python struct模块:https://docs.python.org/2/library/struct.html
下面是代码:
 1 import struct
 2 import gzip
 3 import numpy as np
 4 import matplotlib.pyplot as plt
 5 import matplotlib
 6
 7 def getImage(file):
 8     with gzip.open(file) as f:
 9         buffer = f.read()
10         magicNumber, images, rows, columns = struct.unpack_from('>IIII',buffer)
11         index = 0
12         index += struct.calcsize('>IIII')   #struct.calcsize(fmt)返回这个结构的长度
13         pattern = '>' + str(images*rows*columns) + 'B'  #这里计算了文件的长度,'B'表示为1位无符号字符(unsigned char)
14         data = struct.unpack_from(pattern,buffer,index)     #从index指定的位置开始读
15         return np.array(data).reshape(images, rows, columns)    #因为一个图片是28*28pixel,这里需要reshape
16 def getLabel(file):
17     with gzip.open(file) as f:
18         buffer = f.read()
19         magicNumber, labels = struct.unpack_from('>II',buffer)
20         index = 0
21         index += struct.calcsize('>II')
22         pattern = '>' + str(labels) + 'B'  #这里计算了文件的长度,'B'表示为1位无符号字符(unsigned char)
23         data = struct.unpack_from(pattern,buffer,index)     #从index指定的位置开始读
24         return np.array(data)    #这里label就是一个array不需要reshape
25 if __name__ =='__main__':
26     x_train_data = getImage("train-images-idx3-ubyte.gz")
27     y_train_data = getLabel("train-labels-idx1-ubyte.gz")
28     x_test_data = getImage("t10k-images-idx3-ubyte.gz")
29     y_test_data = getLabel("t10k-labels-idx1-ubyte.gz")
30
31     '''以下为测试模块'''
32     print(x_train_data.shape)
33     print(y_train_data.shape)
34     print(x_test_data.shape)
35     print(y_test_data.shape)
36     x = x_train_data[150]
37     plt.imshow(x,cmap=matplotlib.cm.binary,interpolation="nearest")
38     plt.axis()
39     plt.show()
ps.难以置信我弄好这个后,我不死心试着去运行了书里的代码,竟然自己好了,心情如下:

如需转载请注明出处
喜欢请支持下~