Learning curve 检视过拟合
sklearn.learning_curve 中的 learning curve 可以很直观的看出我们的 model 学习的进度, 对比发现有没有 overfitting 的问题. 然后我们可以对我们的 model 进行调整, 克服 overfitting 的问题.
# View more python learning tutorial on my Youtube and Youku channel!!!

# Youtube video tutorial: https://www.youtube.com/channel/UCdyjiB5H8Pu7aDTNVXTTpcg
# Youku video tutorial: http://i.youku.com/pythontutorial

"""
Please note, this code is only for python 3+. If you are using python 2+, please modify the code accordingly.
"""
from __future__ import print_function
from sklearn.learning_curve import  learning_curve
from sklearn.datasets import load_digits
from sklearn.svm import SVC
import matplotlib.pyplot as plt
import numpy as np

digits = load_digits()
X = digits.data
y = digits.target
train_sizes, train_loss, test_loss= learning_curve(
        SVC(gamma=0.01), X, y, cv=10, scoring='mean_squared_error',
        train_sizes=[0.1, 0.25, 0.5, 0.75, 1])
train_loss_mean = -np.mean(train_loss, axis=1)
test_loss_mean = -np.mean(test_loss, axis=1)

plt.plot(train_sizes, train_loss_mean, 'o-', color="r",
             label="Training")
plt.plot(train_sizes, test_loss_mean, 'o-', color="g",
             label="Cross-validation")

plt.xlabel("Training examples")
plt.ylabel("Loss")
plt.legend(loc="best")
plt.show()

validation_curve 检视过拟合
用这一种曲线我们就能更加直观看出改变模型中的参数的时候有没有过拟合(overfitting)的问题了. 这也是可以让我们更好的选择参数的方法.
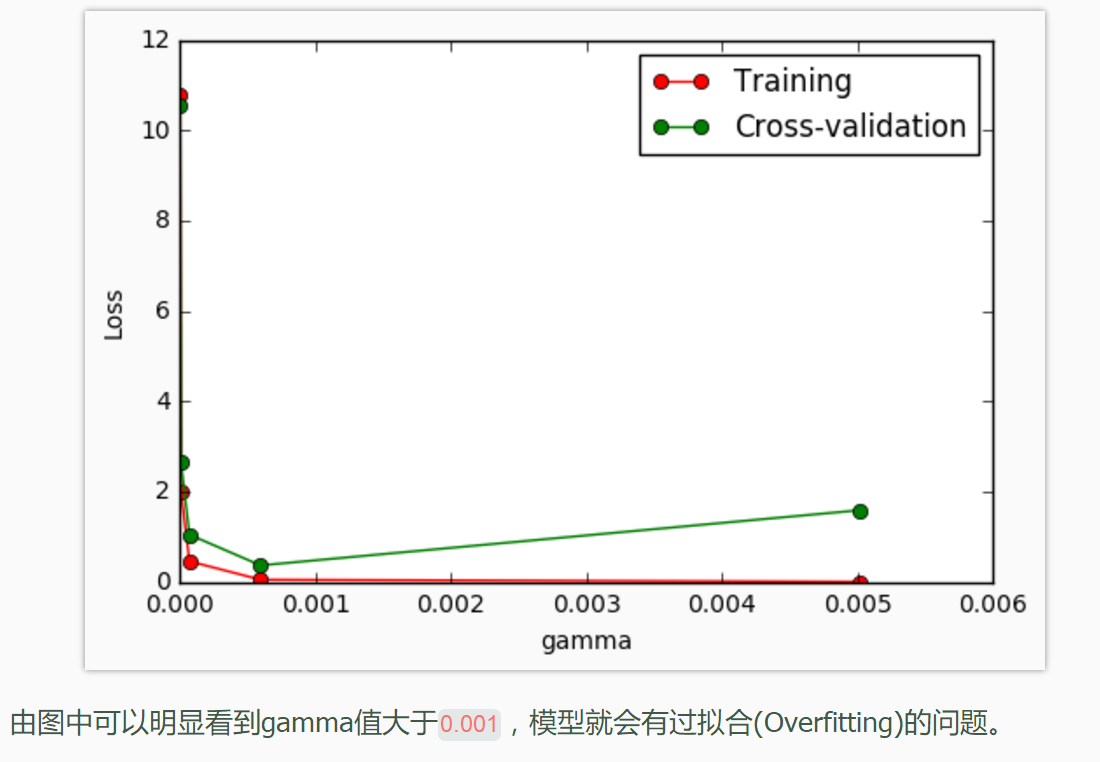
from sklearn.learning_curve import validation_curve #学习曲线模块
from sklearn.datasets import load_digits #digits数据集
from sklearn.svm import SVC #Support Vector Classifier
import matplotlib.pyplot as plt #可视化模块
import numpy as np

digits = load_digits()
X = digits.data
y = digits.target
#建立参数测试集
param_range = np.logspace(-6, -2.3, 5)
#使用validation_curve快速找出参数对模型的影响
train_loss, test_loss = validation_curve(
    SVC(), X, y, param_name='gamma', param_range=param_range, cv=10, scoring='mean_squared_error')

train_loss_mean = -np.mean(train_loss, axis=1)
test_loss_mean = -np.mean(test_loss, axis=1)

#可视化图形
plt.plot(param_range, train_loss_mean, 'o-', color="r",
         label="Training")
plt.plot(param_range, test_loss_mean, 'o-', color="g",
        label="Cross-validation")

plt.xlabel("gamma")
plt.ylabel("Loss")
plt.legend(loc="best")