python-3.7 pycharm serborn-0.9.0
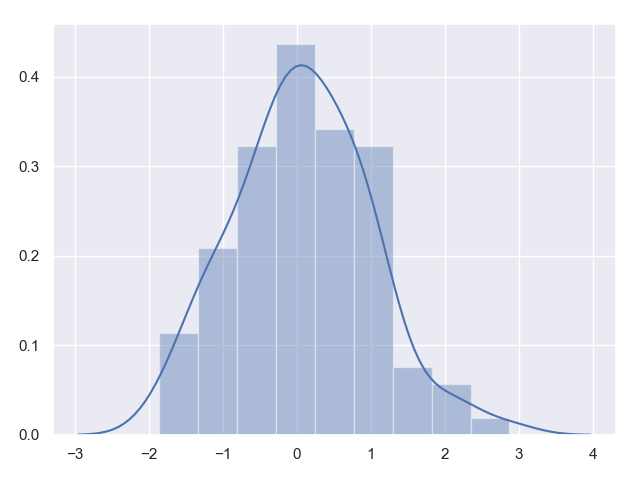
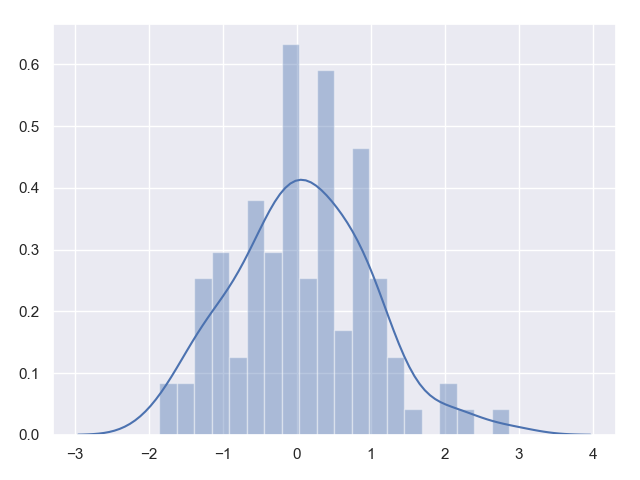
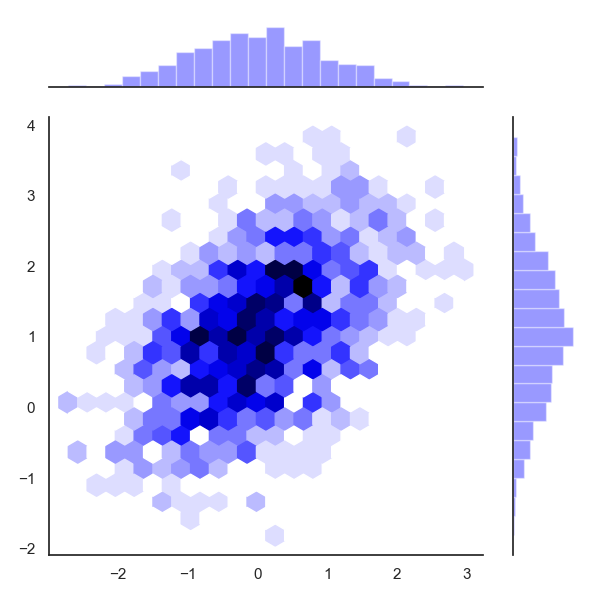
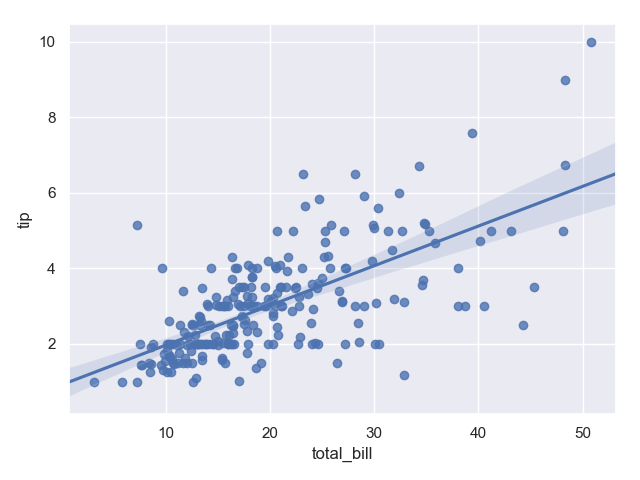
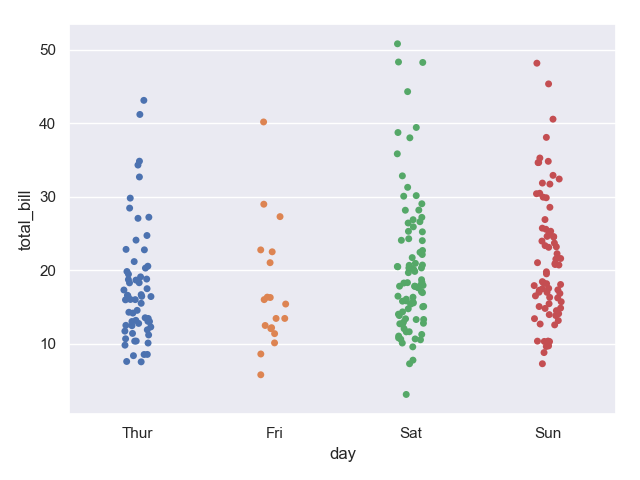
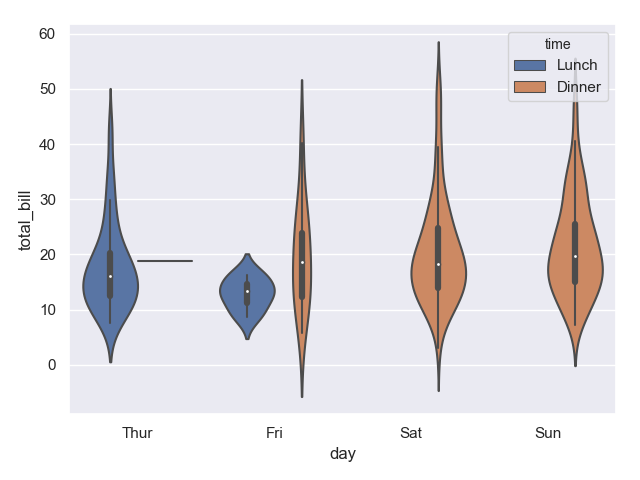
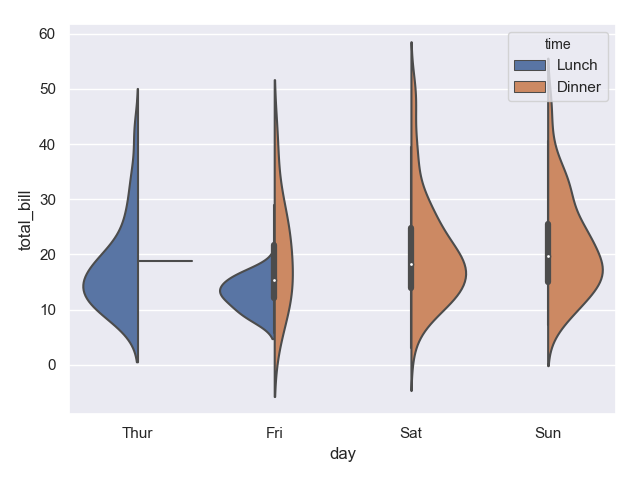
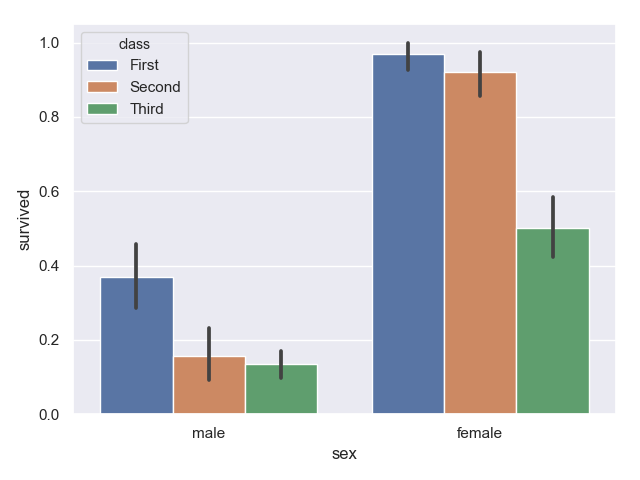
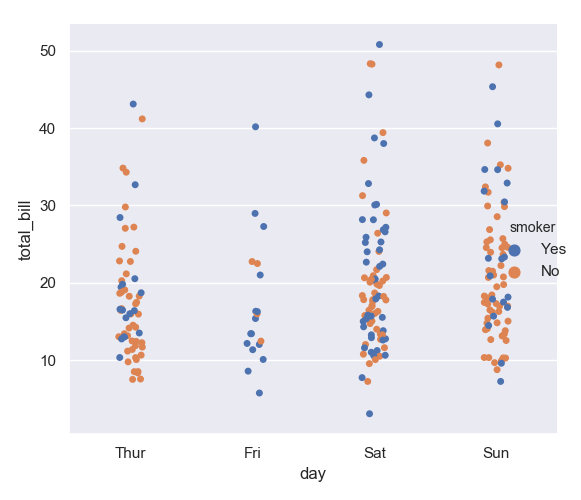
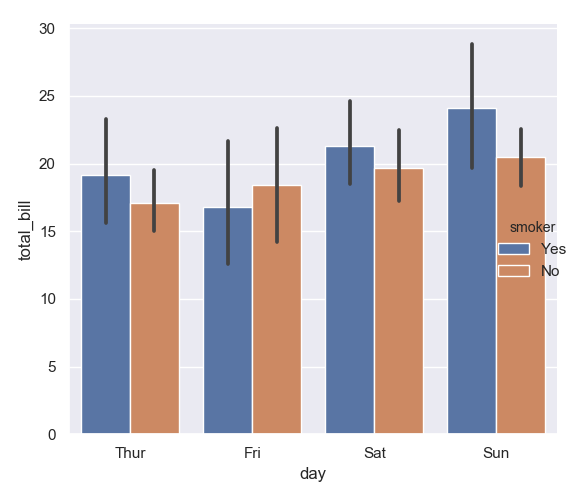
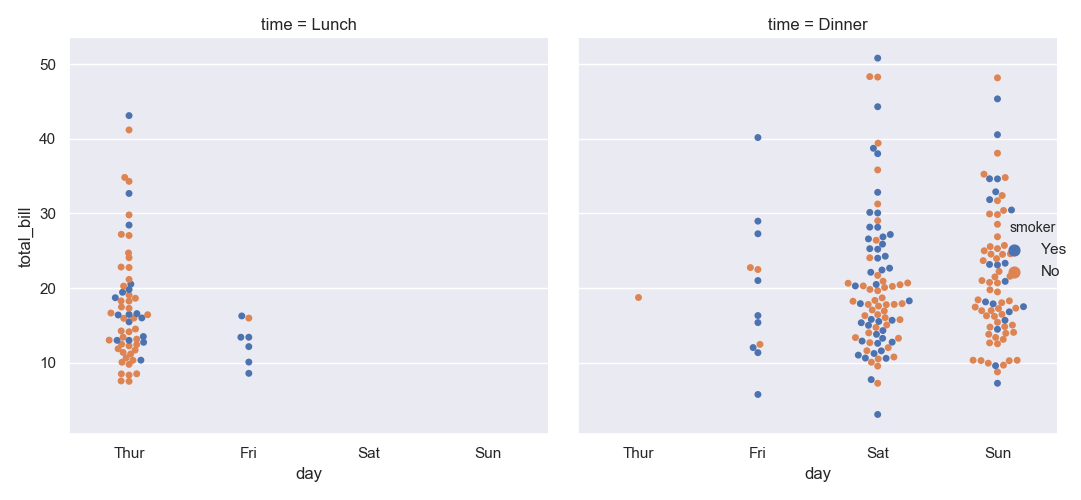
"""
    可视化库Seaborn
    时间:2018913 0013
    分析图绘制,Seaborn封装自Matplotlib
"""
import numpy as np
import pandas as pd
import matplotlib.pyplot as plt
from scipy import stats, integrate
import seaborn as sns

sns.set(color_codes = True)
np.random.seed(sum(map(ord, 'distributions')))
print("""
-------------------单变量分析绘图--------------------------------------
---------------------------------------------------------------
""")
x = np.random.normal(size = 100)
sns.distplot(x, kde = True)  # 直方图,kde密度曲线
plt.show()
sns.distplot(x, bins = 20, kde = True)  # 切分成20个小块
plt.show()
x = np.random.gamma(6, size = 200)
sns.distplot(x, bins = 20, kde = False, fit = stats.gamma)  # 传入统计指标
plt.show()

print("""
-------------------二维分析绘图--------------------------------------
-------------------------------散点图--------------------------
""")
mean, cov = [0, 1], [(1, 0.5), (0.5, 1)]
data = np.random.multivariate_normal(mean, cov, 200)
df = pd.DataFrame(data, columns = ['x', 'y'])
print(df)
sns.jointplot(x = 'x', y = 'y', data = df)
plt.show()

x, y = np.random.multivariate_normal(mean, cov, 1000).T
with sns.axes_style('white'):
    sns.jointplot(x = x, y = y, kind = 'hex', color = 'blue')
plt.show()

iris = sns.load_dataset('iris')
sns.pairplot(iris)
plt.show()

print("""
-------------------回归分析图--------------------------------------
--------------------------regplot(),lmplot()推荐使用regplot()-------------------------------
""")
tips = sns.load_dataset('tips')
print(tips.head())

sns.regplot(x = 'total_bill', y = 'tip', data = tips)  # x轴,y轴,数据DataFrame
plt.show()

sns.lmplot(x = 'total_bill', y = 'tip', data = tips)
plt.show()

sns.regplot(x = 'size', y = 'tip', data = tips)
plt.show()

sns.regplot(x = 'size', y = 'tip', data = tips, x_jitter = 0.05)  # x加入抖动0.05
plt.show()

print("""
-------------------多变量分析图--------------------------------------
--------------------------stripplot(),swarmplot()-------------------------------
""")
titanic = sns.load_dataset('titanic')
sns.stripplot(x = 'day', y = 'total_bill', data = tips, jitter = False)
plt.show()

sns.stripplot(x = 'day', y = 'total_bill', data = tips, jitter = True)  # 左右摆动
plt.show()

sns.swarmplot(x = 'day', y = 'total_bill', data = tips)
plt.show()

sns.swarmplot(x = 'day', y = 'total_bill', data = tips, hue = 'sex')  # 指标
plt.show()

print("""
-------------------盒图--------------------------------------
--------------------------boxplot()-------------------------------
""")
sns.boxplot(x = 'day', y = 'total_bill', data = tips, hue = 'time')  # orient = h横着画
plt.show()

print("""
-------------------小提琴图--------------------------------------
--------------------------violinplot()-------------------------------
""")
sns.violinplot(x = 'day', y = 'total_bill', data = tips, hue = 'time')
plt.show()

sns.violinplot(x = 'day', y = 'total_bill', data = tips, hue = 'time', split = True)
plt.show()

print("""
-------------------组合图--------------------------------------
--------------------------violinplot()-------------------------------
""")
sns.violinplot(x = 'day', y = 'total_bill', data = tips, hue = 'time')
sns.swarmplot(x = 'day', y = 'total_bill', data = tips, hue = 'time', color = 'w', alpha = 0.5)
plt.show()

print("""
-------------------柱状图--------------------------------------
--------------------------barplot()-------------------------------
""")
sns.barplot(x = 'sex', y = 'survived', hue = 'class', data = titanic)
plt.show()

print("""
-------------------点状差异图--------------------------------------
--------------------------barplot()-------------------------------
""")
sns.pointplot(x = 'sex', y = 'survived', hue = 'class', data = titanic)
plt.show()

sns.pointplot(x = 'class', y = 'survived', hue = 'sex', data = titanic,
              palette = {'male': 'g', 'female': "m"},
              markers = ['^', 'o'],
              linestyles = ['-', '--'])

plt.show()

print("""
-------------------多层面板分类图--------------------------------------
--------------------------catplot()-------------------------------
""")
sns.catplot(x = 'day', y = 'total_bill', data = tips, hue = 'smoker')
plt.show()
sns.catplot(x = 'day', y = 'total_bill', data = tips, hue = 'smoker', kind = 'bar')
plt.show()
sns.catplot(x = 'day', y = 'total_bill', data = tips, hue = 'smoker', col = 'time', kind = 'swarm')
plt.show()
sns.catplot(x = 'day', y = 'total_bill', data = tips, hue = 'smoker', col = 'day', kind = 'box', height = 4, width = 5)
# 大小是4,长宽比是5
plt.show()
运行结果