在做数据可视化的过程中,遇到了一个问题,就是给图表tooltip重命名。
在研究后,发现了三种方法:
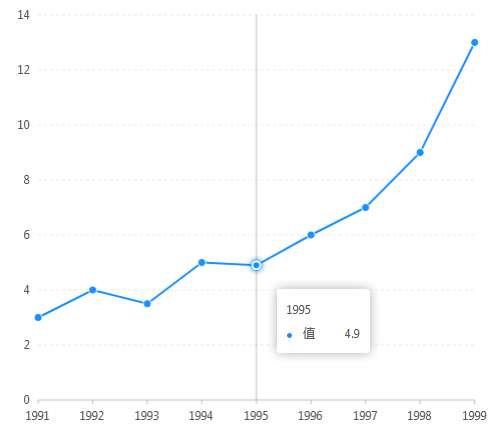
方法1:一般情况下,可以在给chart绑定数据源时,添加scale配置,并在scale配置中设置别名,直接在官网的实例代码中进行修改演示:
代码如下:
const data = [
  { year: '1991', value: 3 },
  { year: '1992', value: 4 },
  { year: '1993', value: 3.5 },
  { year: '1994', value: 5 },
  { year: '1995', value: 4.9 },
  { year: '1996', value: 6 },
  { year: '1997', value: 7 },
  { year: '1998', value: 9 },
  { year: '1999', value: 13 }
];
const chart = new G2.Chart({
  container: 'container',
  forceFit: true,
  height: 500
});
chart.source(data);
chart.scale('value', {
  alias:'值',    //为value字段设置别名,在tooltip显示时则显示别名
  min: 0
});
chart.scale('year', {
  range: [ 0, 1 ]
});
chart.tooltip({
  crosshairs: {
    type: 'line'
  }
});
chart.line().position('year*value');
chart.point().position('year*value')
  .size(4)
  .shape('circle')
  .style({
    stroke: '#fff',
    lineWidth: 1
  });
chart.render();
图像如下:
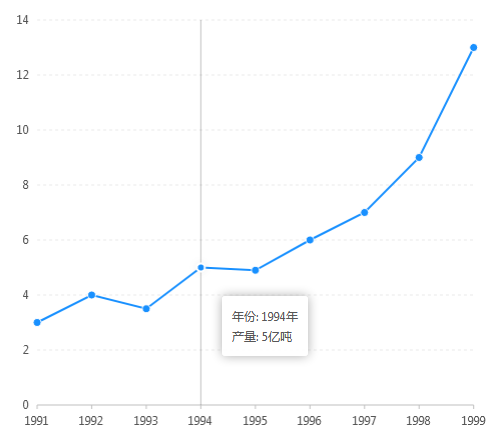
方法2:在geom中添加tooltip属性,返回处理后的结果,并且在chart的tooltip中自定义模板
const data = [
  { year: '1991', value: 3 },
  { year: '1992', value: 4 },
  { year: '1993', value: 3.5 },
  { year: '1994', value: 5 },
  { year: '1995', value: 4.9 },
  { year: '1996', value: 6 },
  { year: '1997', value: 7 },
  { year: '1998', value: 9 },
  { year: '1999', value: 13 }
];
const chart = new G2.Chart({
  container: 'container',
  forceFit: true,
  height: 500
});
chart.source(data);
chart.scale('value', {
  min: 0
});
chart.scale('year', {
  range: [ 0, 1 ]
});
chart.tooltip({
  crosshairs: {
    type: 'line'
  },
    showTitle: false,
    itemTpl: '<li><span>年份: {year}</span><br><span>产量: {yield}</span></li>'
});
chart.line().position('year*value').tooltip('year*value',function(year,value){
  /**
  *此处也可以添加数据处理语句
  */
  return {
    year:year+'年',
    yield:value+'亿吨',
  }
});
chart.point().position('year*value')
  .size(4)
  .shape('circle')
  .style({
    stroke: '#fff',
    lineWidth: 1
  }).tooltip('year*value',function(year,value){
  /**
  *此处也可以添加数据处理语句
  */
  return {
    year:year+'年',
    yield:value+'亿吨',
  }
});
chart.render();
图像如下:
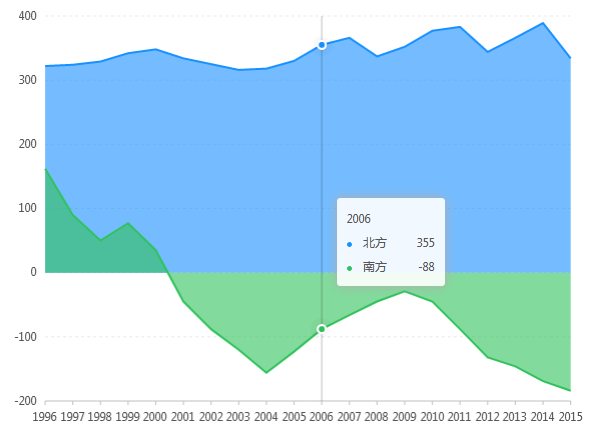
方法3:若数据源经过了transform的fold转换,有些情况下前两种方法可能就不会适用了,因为在数据转换前,格式是{ year: '1996', north: 322, south: 162 },
在经过fold转换后,格式为{"year": "1996","type": "north","value": 322},{"year": "1996","type": "south","value": 162}
此时已经无法为north和south设置别名了,这时我们可以在fold转换前在进行一次rename转换。
const { DataView } = DataSet;
const data = [
  { year: '1996', north: 322, south: 162 },
  { year: '1997', north: 324, south: 90 },
  { year: '1998', north: 329, south: 50 },
  { year: '1999', north: 342, south: 77 },
  { year: '2000', north: 348, south: 35 },
  { year: '2001', north: 334, south: -45 },
  { year: '2002', north: 325, south: -88 },
  { year: '2003', north: 316, south: -120 },
  { year: '2004', north: 318, south: -156 },
  { year: '2005', north: 330, south: -123 },
  { year: '2006', north: 355, south: -88 },
  { year: '2007', north: 366, south: -66 },
  { year: '2008', north: 337, south: -45 },
  { year: '2009', north: 352, south: -29 },
  { year: '2010', north: 377, south: -45 },
  { year: '2011', north: 383, south: -88 },
  { year: '2012', north: 344, south: -132 },
  { year: '2013', north: 366, south: -146 },
  { year: '2014', north: 389, south: -169 },
  { year: '2015', north: 334, south: -184 }
];
// 数据需要加工成 {year: '1996', type: 'north', value: 50} 的模式
const dv = new DataView().source(data);
dv.transform({
  type:'rename',
  map:{
    north:'北方',
  	south:'南方',
  }
})
dv.transform({
  type: 'fold',
  fields: [ '北方', '南方' ], // 展开字段集
  key: 'type',                  // key字段
  value: 'value'               // value字段
});

const chart = new G2.Chart({
  container: 'container',
  forceFit: true,
  height: 500
});
chart.source(dv, {
  year: {
    range: [ 0, 1 ]
  }
});
chart.tooltip({
  crosshairs: {
    type: 'line'
  }
});
chart.area().position('year*value').color('type');
chart.line().position('year*value').color('type')
  .size(2);
chart.render();
图像如下:
目前发现了这三种方法,若有其他更好的方法,请留言,共同学习