- Matplotlib 是 python 最著名的绘图库。它提供了一整套和 MATLIB 相似的命令API,十分适合交互式地进行制图。而且也可以方便的将它作为绘图控件,嵌入GUI应用程序中。
- Matplotlib.pyplot 是绘制各类可视化图形的命令字库,相当于快捷方式。
- Matplotlib 文档相当完备,并且Gallery页面中有上百幅缩略图,打开之后都有源代码。因此如果你需要绘制某种类型的图,只需要在这个页面中浏览、复制、粘贴一下,基本上通过修改数据和设置都能搞定。
选取Gallery中一幅略缩图示例:
import numpy as np
import matplotlib.pyplot as plt
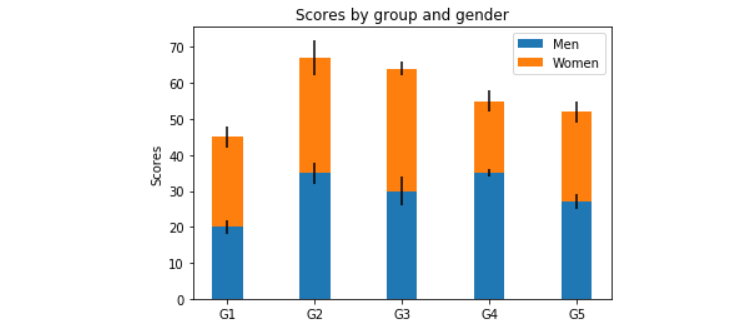
labels = ['G1', 'G2', 'G3', 'G4', 'G5']
men_means = [20, 35, 30, 35, 27]
women_means = [25, 32, 34, 20, 25]
men_std = [2, 3, 4, 1, 2]
women_std = [3, 5, 2, 3, 3]
width = 0.35 # the width of the bars: can also be len(x) sequence
fig, ax = plt.subplots()
ax.bar(labels, men_means, width, yerr=men_std, label='Men')
ax.bar(labels, women_means, width, yerr=women_std, bottom=men_means,
label='Women')
ax.set_ylabel('Scores')
ax.set_title('Scores by group and gender')
ax.legend()
plt.show()