Problem
What exactly are SQL Server Analysis Services (SSAS) Aggregations and how exactly can I review and use them?
Solution
Aggregations in SSAS offer a wonderful opportunity to improve query performance and calculation times by "pre aggregating" sets of data. These aggregations allow a cube query to ask for a specific value or set of values for a specific group of dimension attributes (a set), and have the calculation already completed before the query was even asked. The aggregation and related query could ask for a single value or actually cover a whole set of values to be returned. Without the aggregations, the query would return results much slower and with more CPU and memory intensity as the query must complete the aggregation calculations at run time, which of course takes significantly longer than if the data points are already summarized to the desired level of the query. Of course it is a trade off between creating a large number of aggregations which speed up query performance versus increase processing time and memory needed to process the cube.
Establishing Aggregations
There are three distinct methods of defining aggregations currently available to cube designers.
The first method utilizes the Aggregation Design wizard to create a group of aggregations by comparing the amount of space required to store and process the aggregation vs. the time it would take to query for the same values. Siddharth Mehta completed an excellent tip on using the Aggregation Design wizard, which is available at: http://www.mssqltips.com/sqlservertip/2439/optimize-a-sql-server-analysis-services-measure-group-partition-for-performance/. This method is a good start; however it treats all possible combinations of aggregations as equally possible, so some aggregations may get created, but never be used.
The second method, called Usage Based Optimization, uses the SSAS Query log which must be turned on and then is used as a basis to establish the aggregations. This method addresses the problem with the Aggregation Design wizard by recording every n number of queries from SSAS. This recording is controlled by the Log Query Log properties and is set at the server level as shown in the below illustration. The tip, http://www.mssqltips.com/sqlservertip/2876/improve-sql-server-analysis-services-performance-with-the-usage-based-optimization-wizard/, written by Daniel Calbimonte provides a superb review of this topic. We could record every query, but that method has the potential to generate a very large table with many queries (which could impact performance).

So if we have these two methods of creating aggregations why do we need a third method?
The third method allows us to actually create aggregations based on the intended use of the SSAS database and at the desired level of detail or summation. In essence, this method allows us to decide exactly what aggregations need to be created at any desired attribute or hierarchy level and combination of attributes. Often, I compare the Aggregation Design wizard and the Query Log to the Database Tuning Adviser (DTA) in regular SQL Server. They both provide good starter advice to assist with creating high performing and responsive queries. However, you will often need to move beyond this introductory level of detail as your Cube increases in size, use, and complexity.
The first step in the process is to review your existing aggregates. We will again use the AdventureWorks DW SSAS database to review the existing aggregations and create new aggregations from scratch. This database is available for download for free, on CodePlex at: http://msftdbprodsamples.codeplex.com/releases/view/55330. Once you have the SQL Server and OLAP AdventureWorks databases installed, you will start SQL Server Data Tools (SSDT); SSDT is the new name for Business Intelligence Development Studio in SQL Server 2012.
We can now review the data aggregations that were previously created and then move to creating some new aggregations. In order to see the existing aggregations, you need to open the AdventrureWorks Cube and then click on the aggregation tab, as seen in the next screen print.

Before we move on, let us discuss a few concepts shown in the above screen print. First, on the left side, you see all your measure groups. In the above instance, the Internet Sales measure group has 1 Aggregation Design. In its simplest form an Aggregation Design is like a container or folder for the embedded aggregations. These aggregation designs can be tied to one or more partitions, but to only one measure group. For the above example, the Internet Sales aggregation design is tied to the Internet Sales partition and contains 41 individual aggregations. If no aggregations have been defined then the aggregation design says "Unassigned Aggregation Design" as illustrated next.

Although it is not readily apparent, two views aggregation views are available and each enables different options and settings. The default view is the standard view and is displayed next. You will notice the first two buttons are not grayed and are available to utilize. These buttons invoke the Aggregation Design wizard and Usage Based Optimization wizard. The standard view is invoked by clicking on the 4th button from the left.

The advanced view is implemented by clicking on the 5th button from the left (with the sigma symbol), and is shown below. You notice how the Aggregation Design wizard button and Usage Based Optimization wizard button both dim when you move to the advanced view, but the New Aggregation button, to the right of the standard view is available. The standard view definitely does not provide any details above the specific aggregation details, so we must move to the advanced view to see these details.

On the advanced view, as shown below, we need to select the measure group name, the Aggregation Design name, the sorting we would like to see and finally what range of aggregations we would like to display (steps 1 to 4). As the number of aggregations increases, the range field helps to manage the list and keep you from scrolling forever. You will also notice in the below screen print, that we actually get to see what dimension attributes make up each aggregate; one aggregate is setup for the Promotion Category while another if setup for the Discount Percent.

As an example, say after analyzing our usage patterns, we decide we need to add an aggregation by Product and Fiscal Year as those items will make up a common query for the Internet Sales measure group. To complete this task, you can right mouse click in aggregation detail area and select New Aggregation.

The new aggregation becomes A0 while the remaining aggregations "move" one column to the right (note the numbering is zero based). Now to create the aggregation, we simply click on the check box next to the dimension attributes which should be included in the aggregation and as shown below. Finally to complete the process, click on the save button.

SSAS also provides "caution warning messages" in the status row. This warning stems from the fact that within the Ship Date dimension, a hierarchy relationship already exists between the Date field and the Fiscal Year field, and thus creating an aggregation with both these items would be redundant. Also notice how next to each attribute the number of attribute values is listed which gives you an indication of the aggregation size.

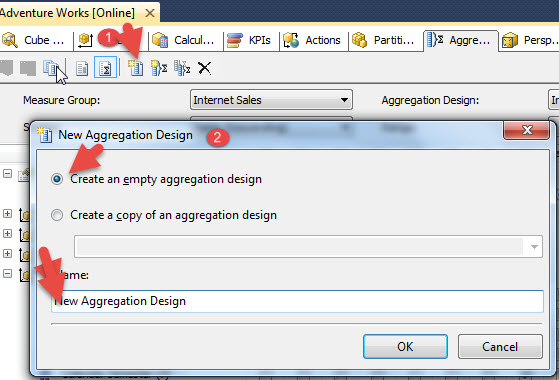
We can also create a new Aggregation Design by clicking on the New Aggregation Design button, step 1 in the below screen print. Then we define whether we want to copy an existing aggregation design or create a completely new one. Finally, the aggregation design needs to be named. As you can preview in the second screen print below, the new aggregation design was added to the Internet Sales measure group.

Conclusion
Just like with SQL Server indexes, there are several layers of design available for setting up aggregations in SSAS. You can use the Aggregation Design wizard and Usage Based Optimization wizard to setup aggregations in just a few steps. However, SSAS also provides a method of reviewing and even adding individual aggregation designs (aggregation groups) and individual aggregations. In order to create new aggregations, you must switch to the advanced view within the cube aggregation tab. Once on the Advanced view, individual dimension attributes can be added to your own custom aggregations which are tailored to your specific SSAS cube design and usage.
Next Steps
•Check out these related resources:
Optimize a SQL Server Analysis Services Measure Group Partition for Performance
Improve SQL Server Analysis Services Performance with the Usage Based Optimization Wizard
•SSAS Aggregations and Impact on Storage - http://technet.microsoft.com/en-us/library/ms174915(v=sql.110).aspx