具体代码:
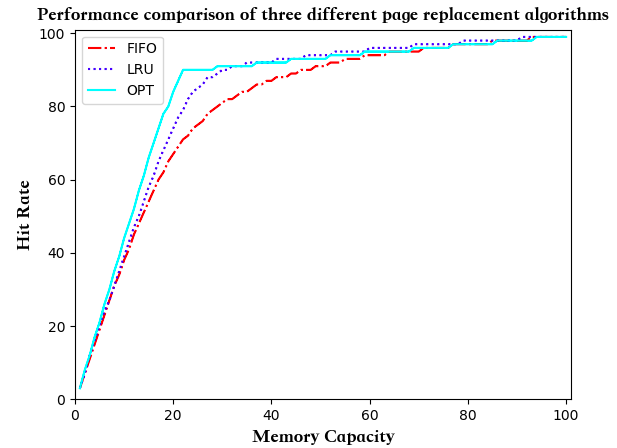
# encoding: utf-8
# coding = utf-8
import sys
reload(sys)
sys.setdefaultencoding('utf8')
from matplotlib.font_manager import FontProperties

import numpy as np
import matplotlib.pyplot as plt
import matplotlib as mpl
import matplotlib
print ( matplotlib.matplotlib_fname() )

#mpl.rcParams['font.family'] = 'sans-serif'
#mpl.rcParams['font.sans-serif'] = [u'Simsun']
#mpl.rcParams['axes.unicode_minus'] = False

font = FontProperties(fname=r"/Users/zhao/anaconda2/lib/python2.7/site-packages/matplotlib/mpl-data/fonts/ttf/Songti.ttc")
#font = {'family' : 'SimSun' }
#mpl.rc('font', **font)
str =""
FIFO_y = []
LRU_y = []
OPT_y = []
try:
        f = open( "FIFO.txt","r")
        str = f.read()
finally :
        if f :
                f.close()

FIFO_ty = str.split()
FIFO_y = [ float(i) for i in FIFO_ty ]
print(type(FIFO_y[0]))
try:
        f = open( "LRU.txt","r")
        str = f.read()
finally :
        if f :
                f.close()
LRU_ty = (str.split())
LRU_y = [ float(i) for i in LRU_ty ]
try:
        f = open( "OPT.txt","r")
        str = f.read()
finally :
        if f :
                f.close()
OPT_ty = (str.split())
OPT_y = [ float(i) for i in OPT_ty ]

print( FIFO_y )
print( LRU_y )
print( OPT_y )

X = np.arange ( 1,101,1)
FIFO_Y = np.array( FIFO_y )
LRU_Y = np.array( LRU_y )
OPT_Y = np.array( OPT_y )

plt.title( " Performance comparison of three different page replacement algorithms ",fontproperties=font,fontsize = 14)
plt.xlabel( " Memory Capacity ",fontproperties=font,fontsize = 14 )
plt.ylabel( " Hit Rate ",fontproperties=font,fontsize = 14)
plt.ylim( 0,101 )
plt.xlim( 0,101 )

#plt.plot ( X , FIFO_Y )
plt.plot( X , FIFO_Y,color = "red" ,label = " FIFO ",linestyle="-.")
plt.plot( X , LRU_Y ,color = "blue",label = " LRU ",linestyle=":")
plt.plot( X,OPT_Y ,color = "cyan",label = " OPT ")
plt.legend( ['FIFO','LRU','OPT'] )

plt.savefig("Rate.png")
plt.show()
实际效果: