目录:
- 一、安装Jmeter
- 二、接口压力测试
一、安装Jmeter
具体如何安装就不阐述了,下面分享我的两篇文章:
①Win系统参考文章:《【JMeter4.0】之 “jdk1.8、JMeter4.0” 安装与配置以及JMeter永久汉化和更改界面背景、并附加附录:个人学习总结》
②Mac系统参考文章:《JMeter压力测试演练(Mac版)》
二、接口压力测试
层级结构如下图:
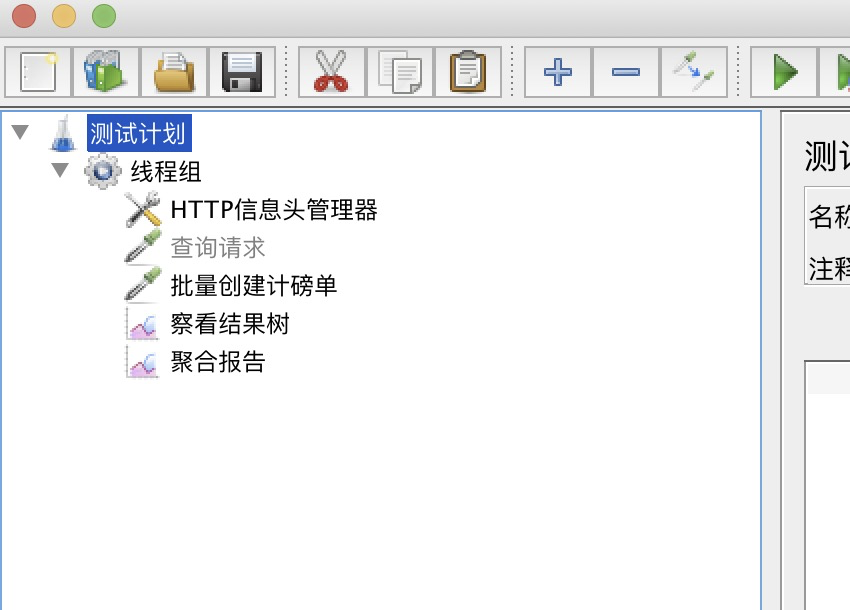
层级说明:
1、测试计划 返回目录
默认创建就可以了,不需要添加设置
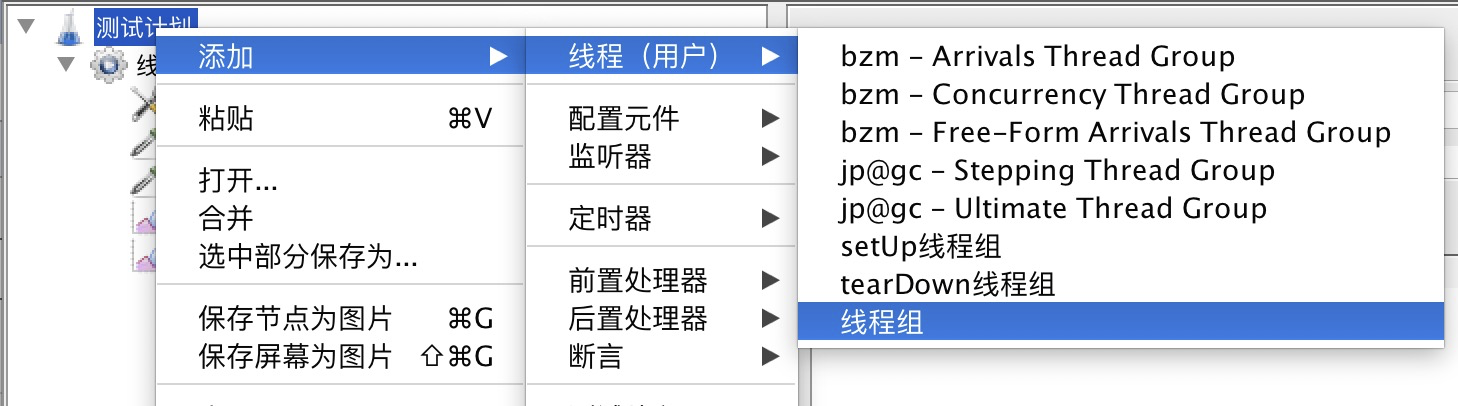
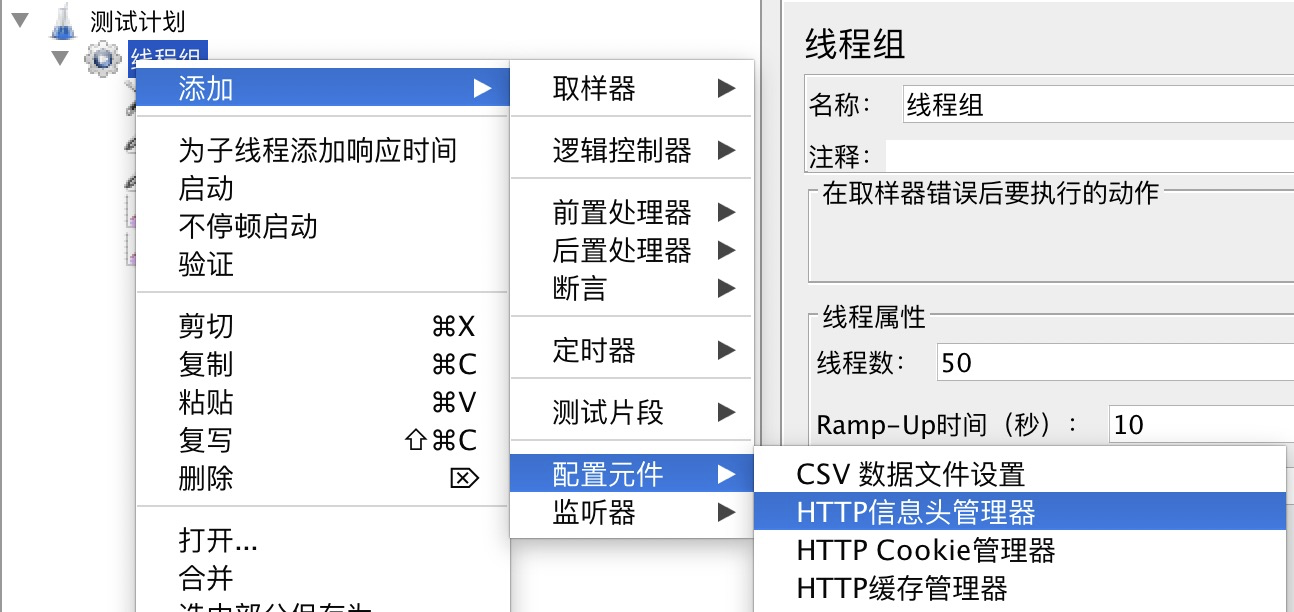
2、线程组 返回目录
①线程数:执行线程的数量,相当于请求接口次数
②时间:执行所有线程所需要的时间
③循环次数:执行线程循环的次数
计算公式:请求总执行量 = 线程数*循环次数
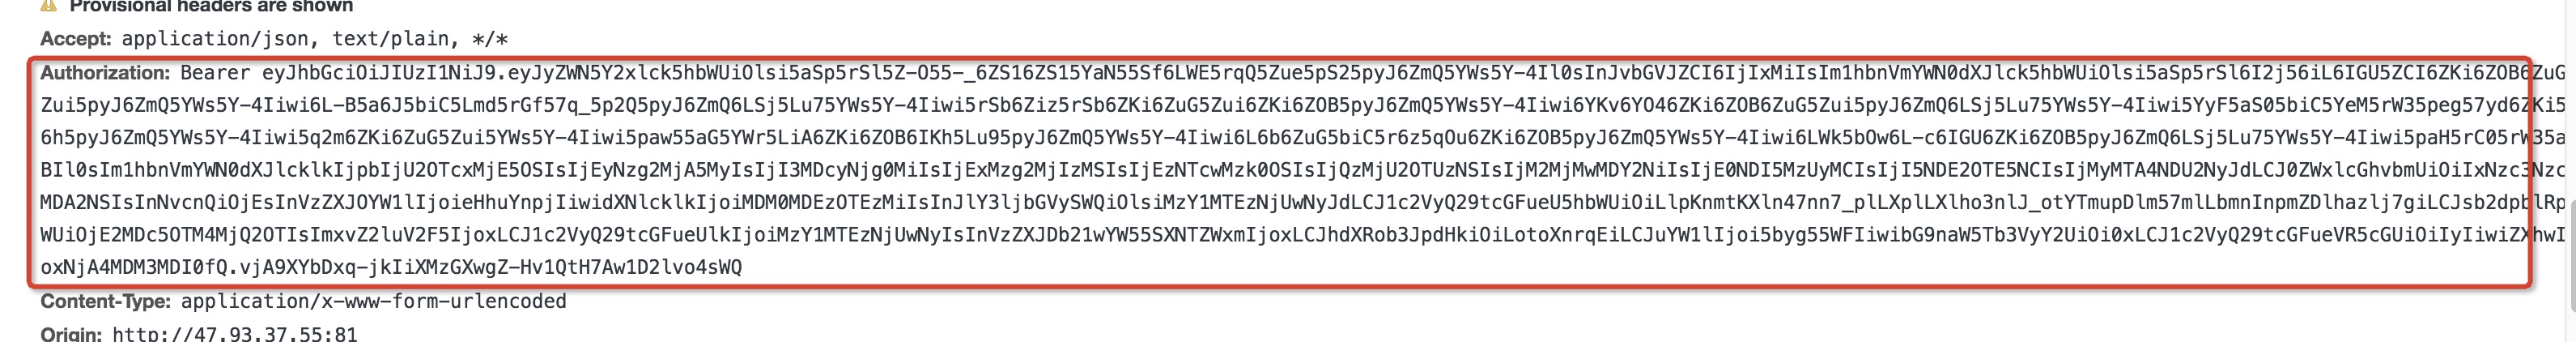
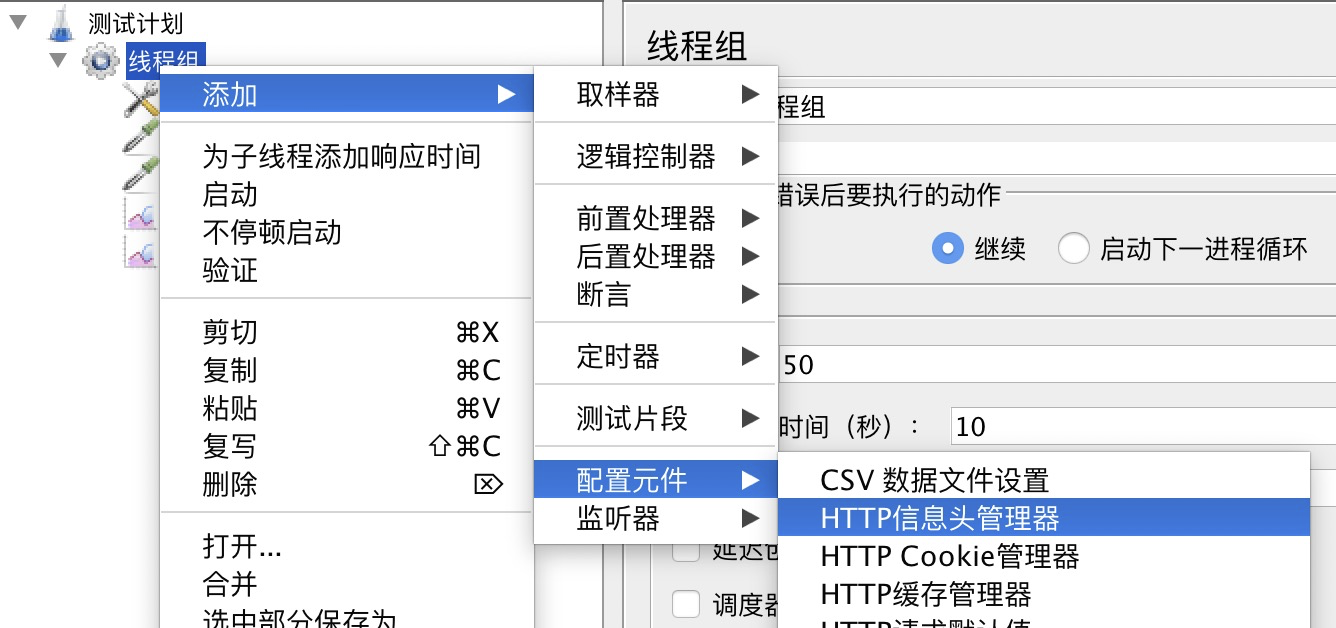
3、HTTP信息头管理器 返回目录
①添加信息头:
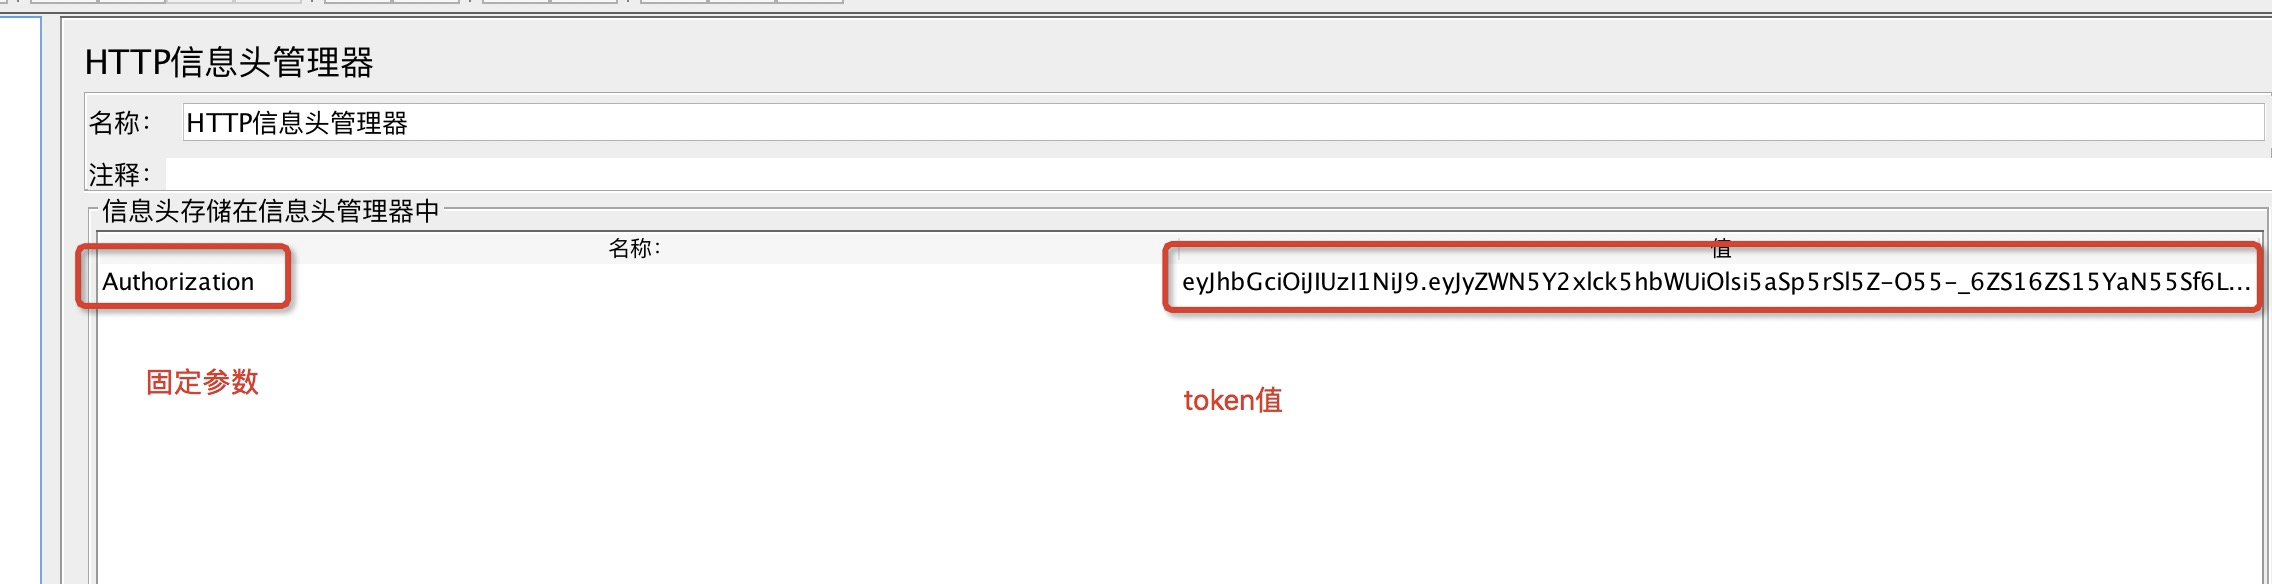
Authorization token的值
token值可以通过浏览器F12获取请求参数
4、HTTP请求 返回目录
①服务器以及HTTP请求,如下图对应的
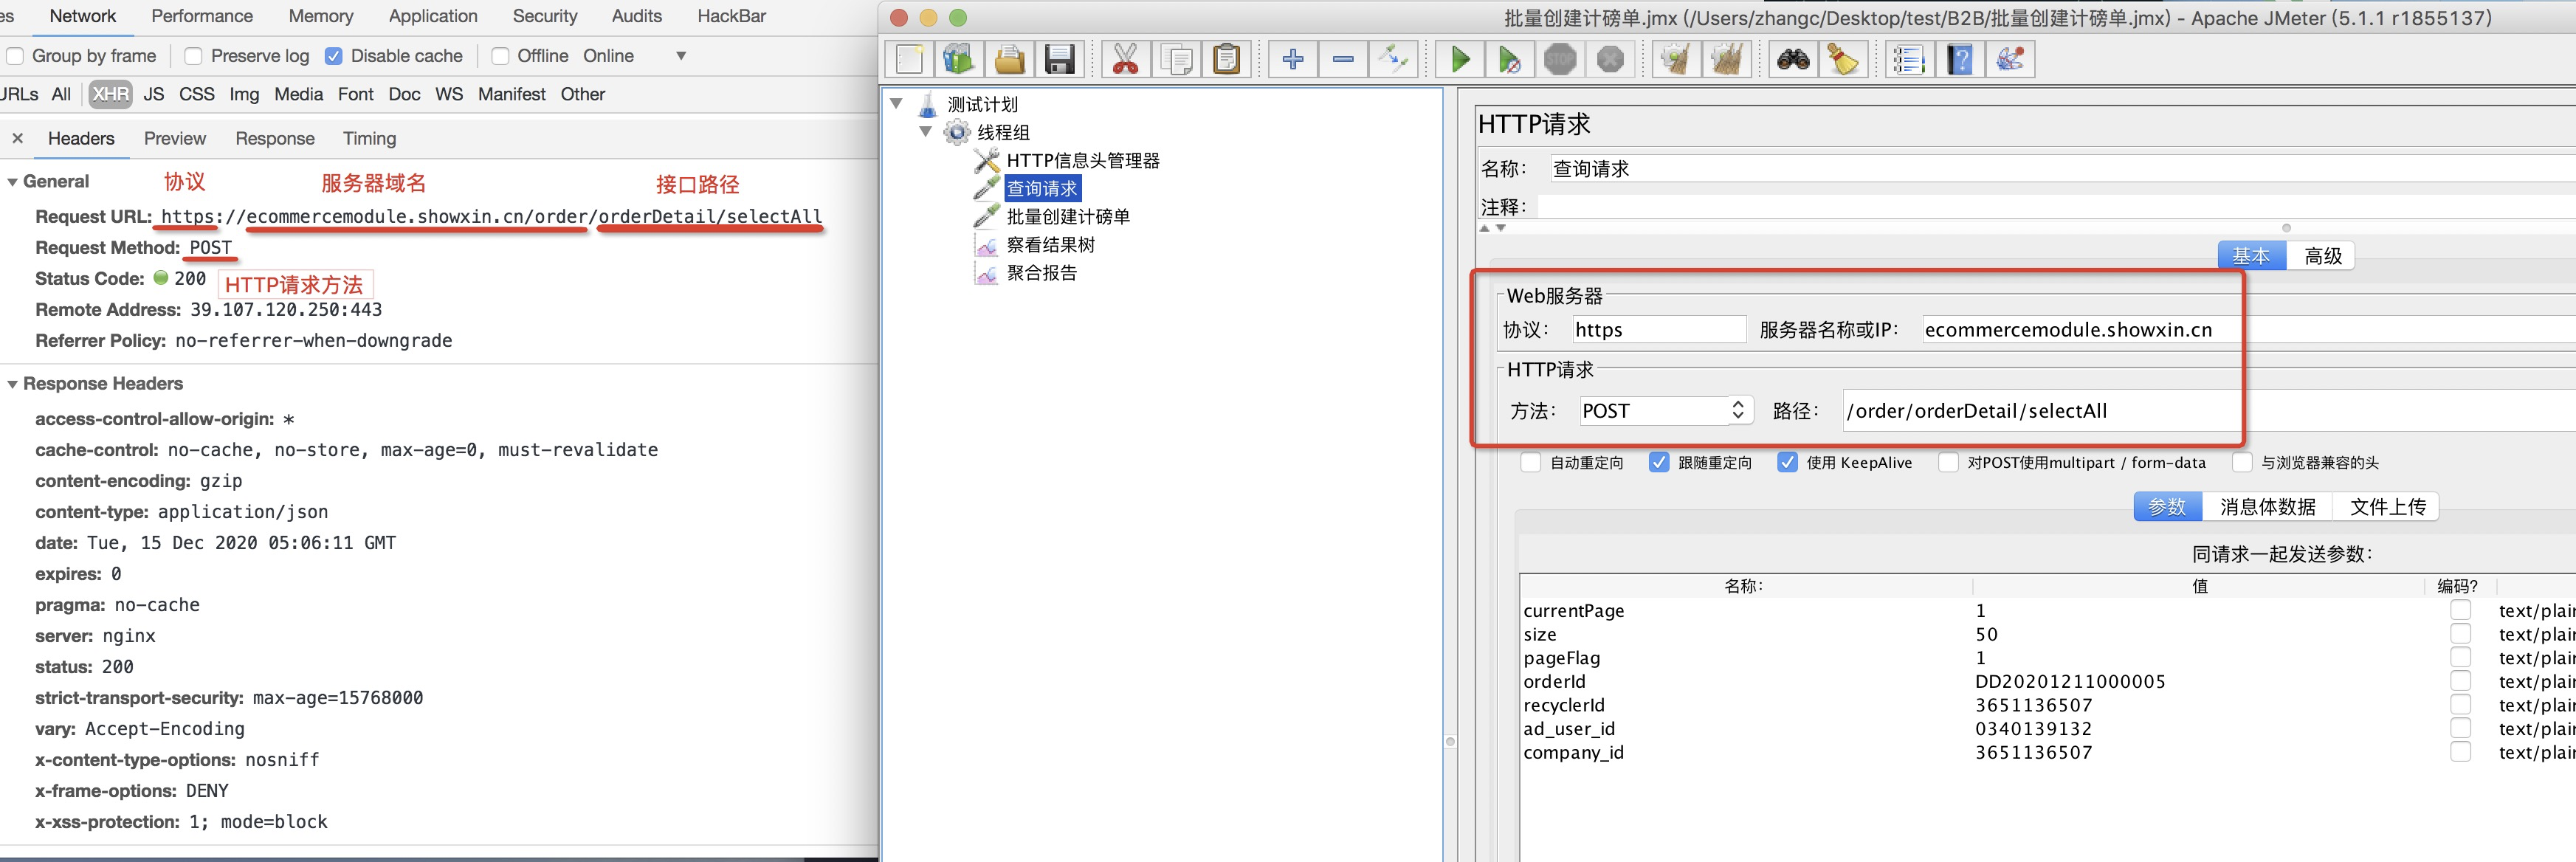
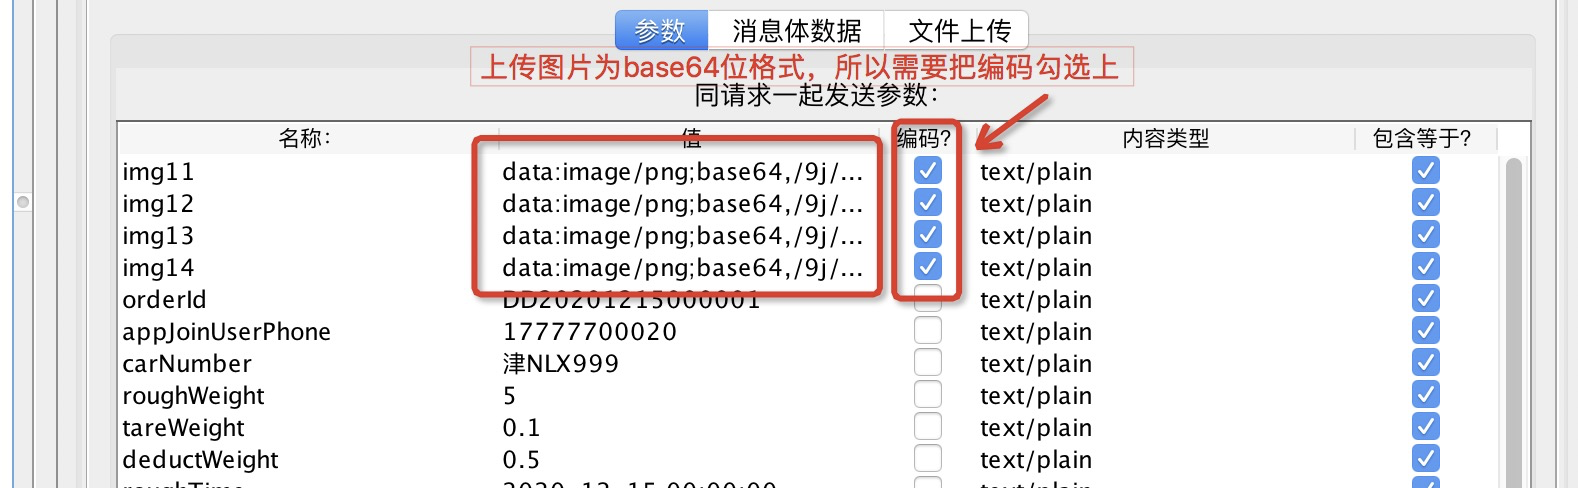
②请求参数,参考如下

注意:请求参数为base64位时,需要把编码勾选上
5、监听器 返回目录
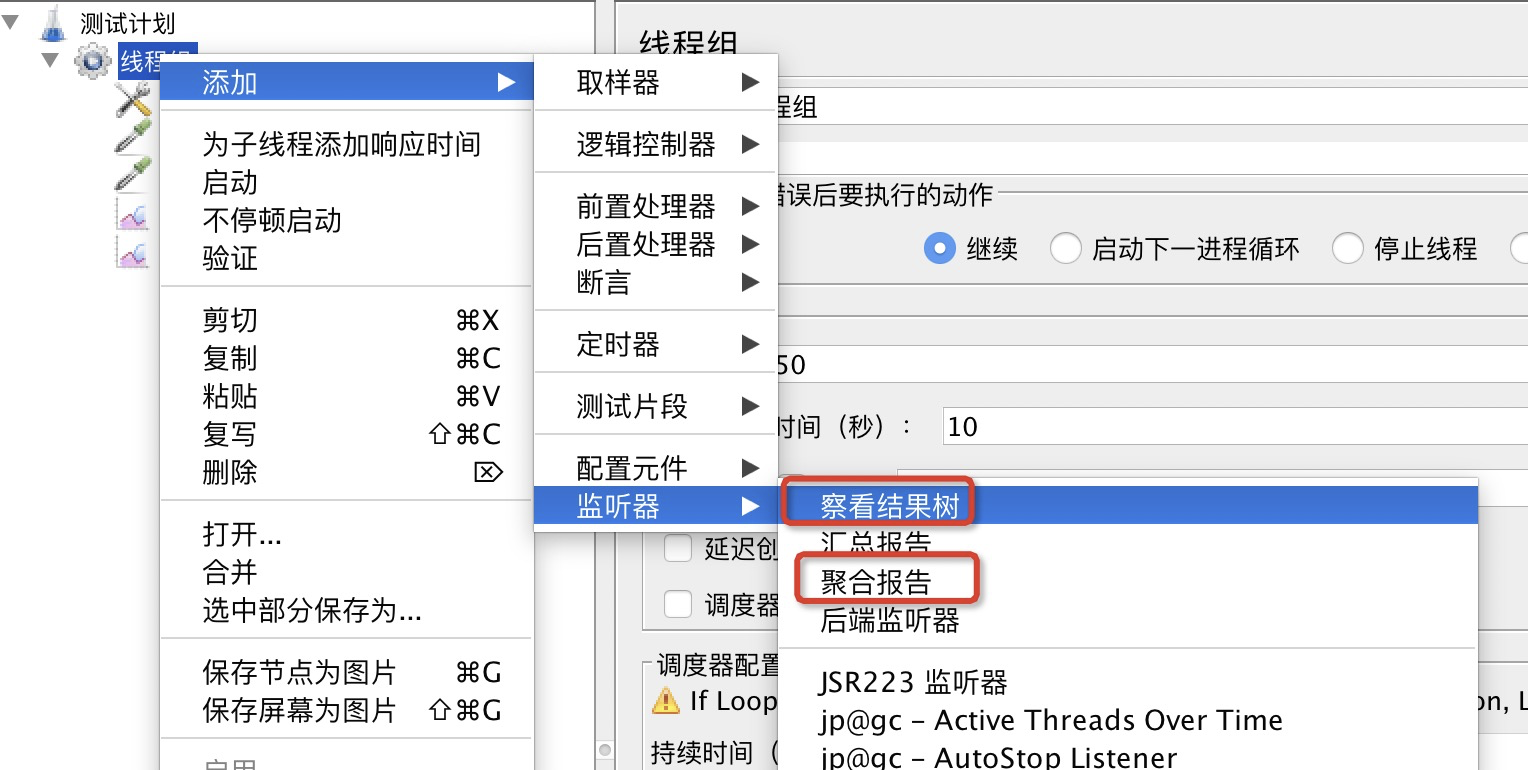
常用的有【查看结果树、聚合报告】
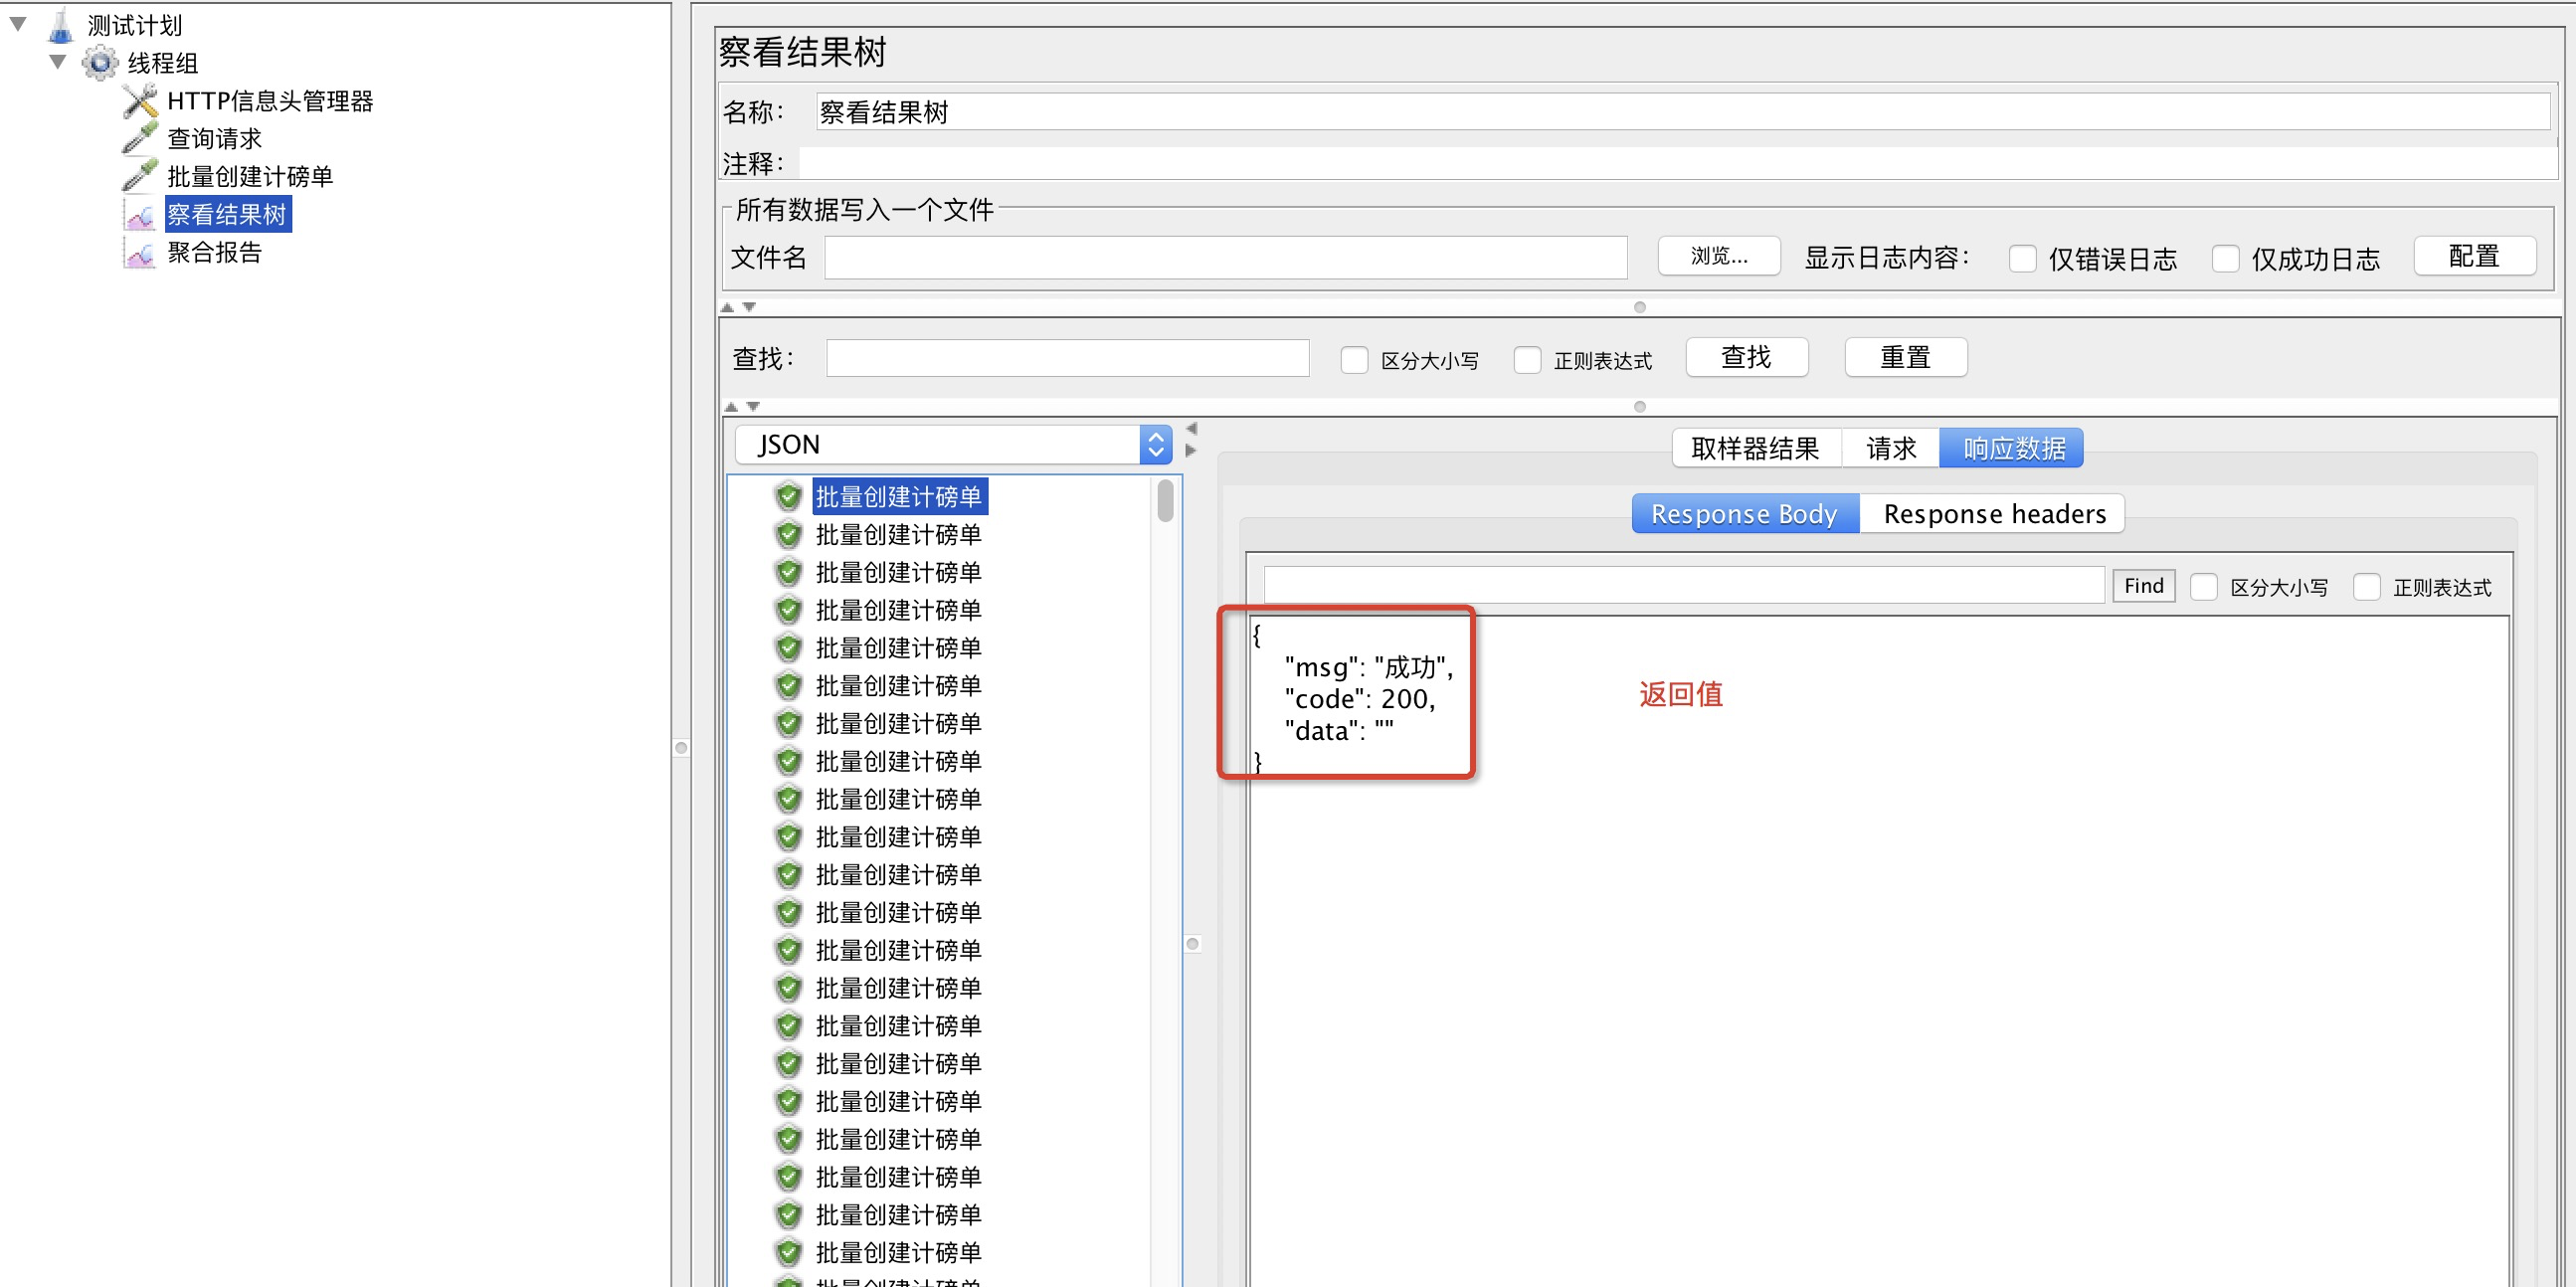
①查看结果树
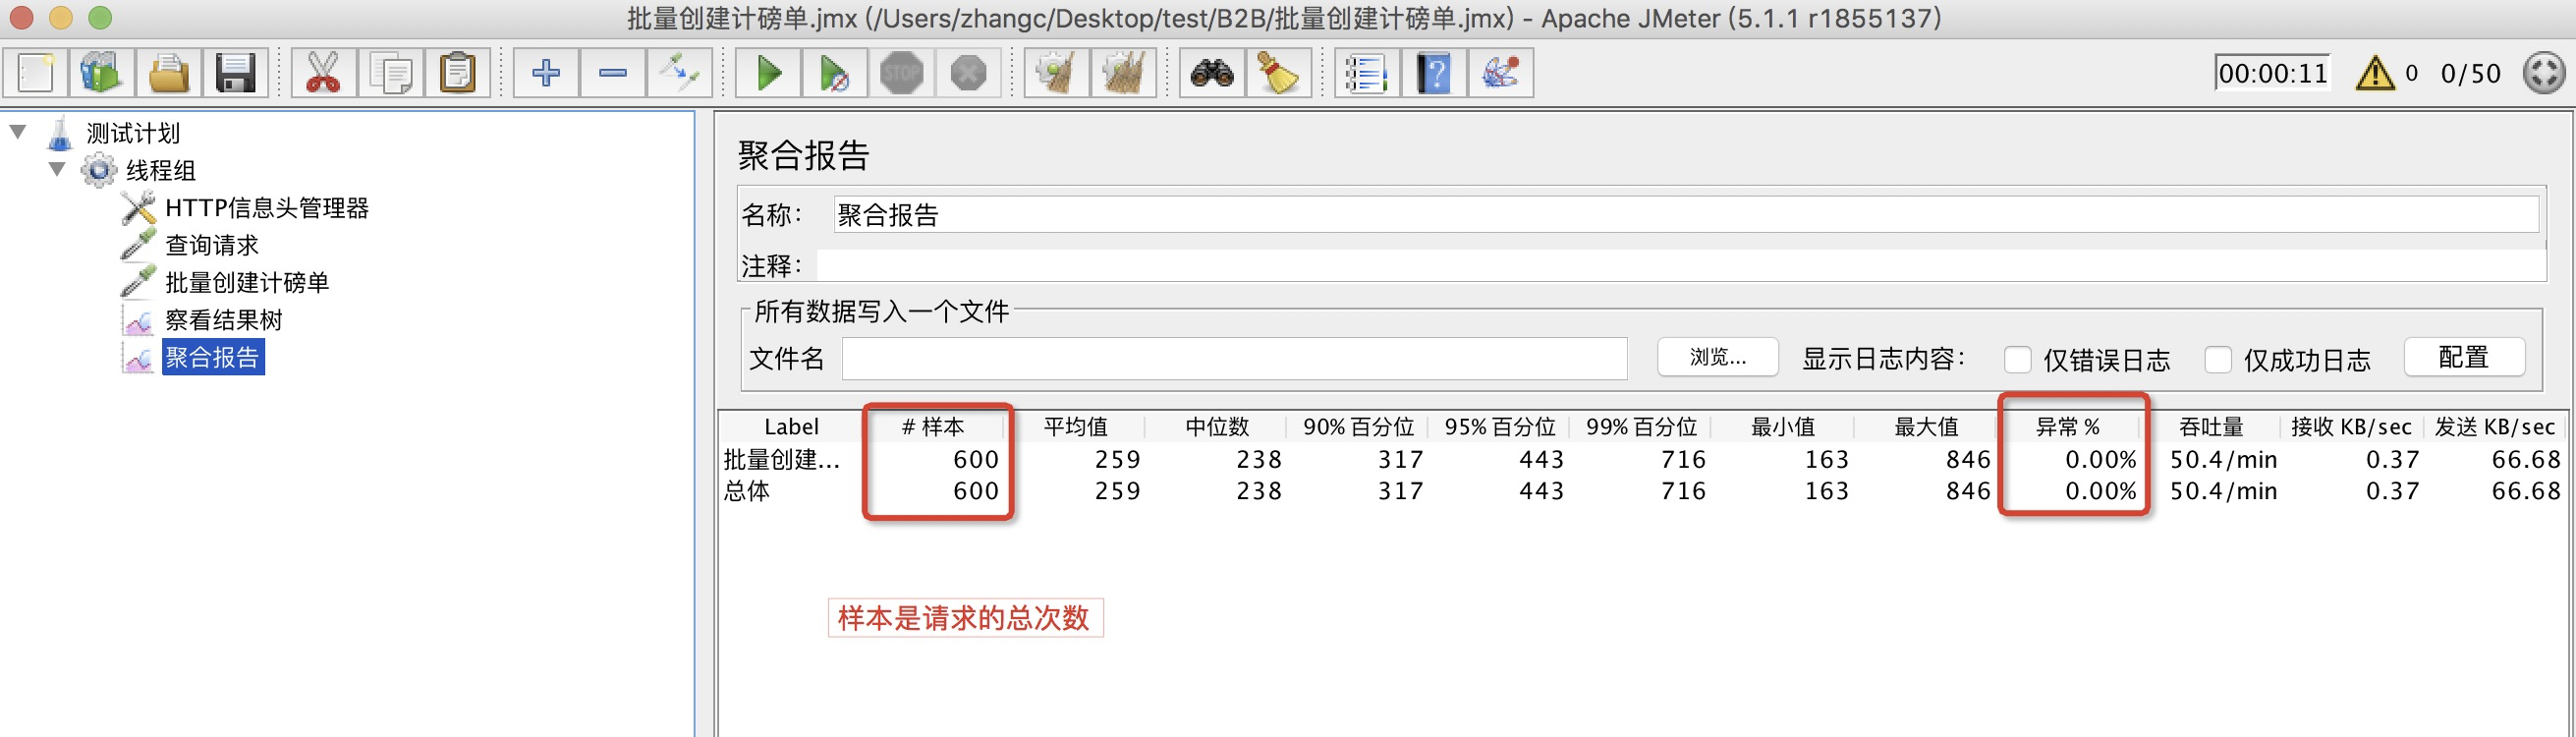
②聚合报告
主要查看请求接口一些报告数值
③其他
图形结果:
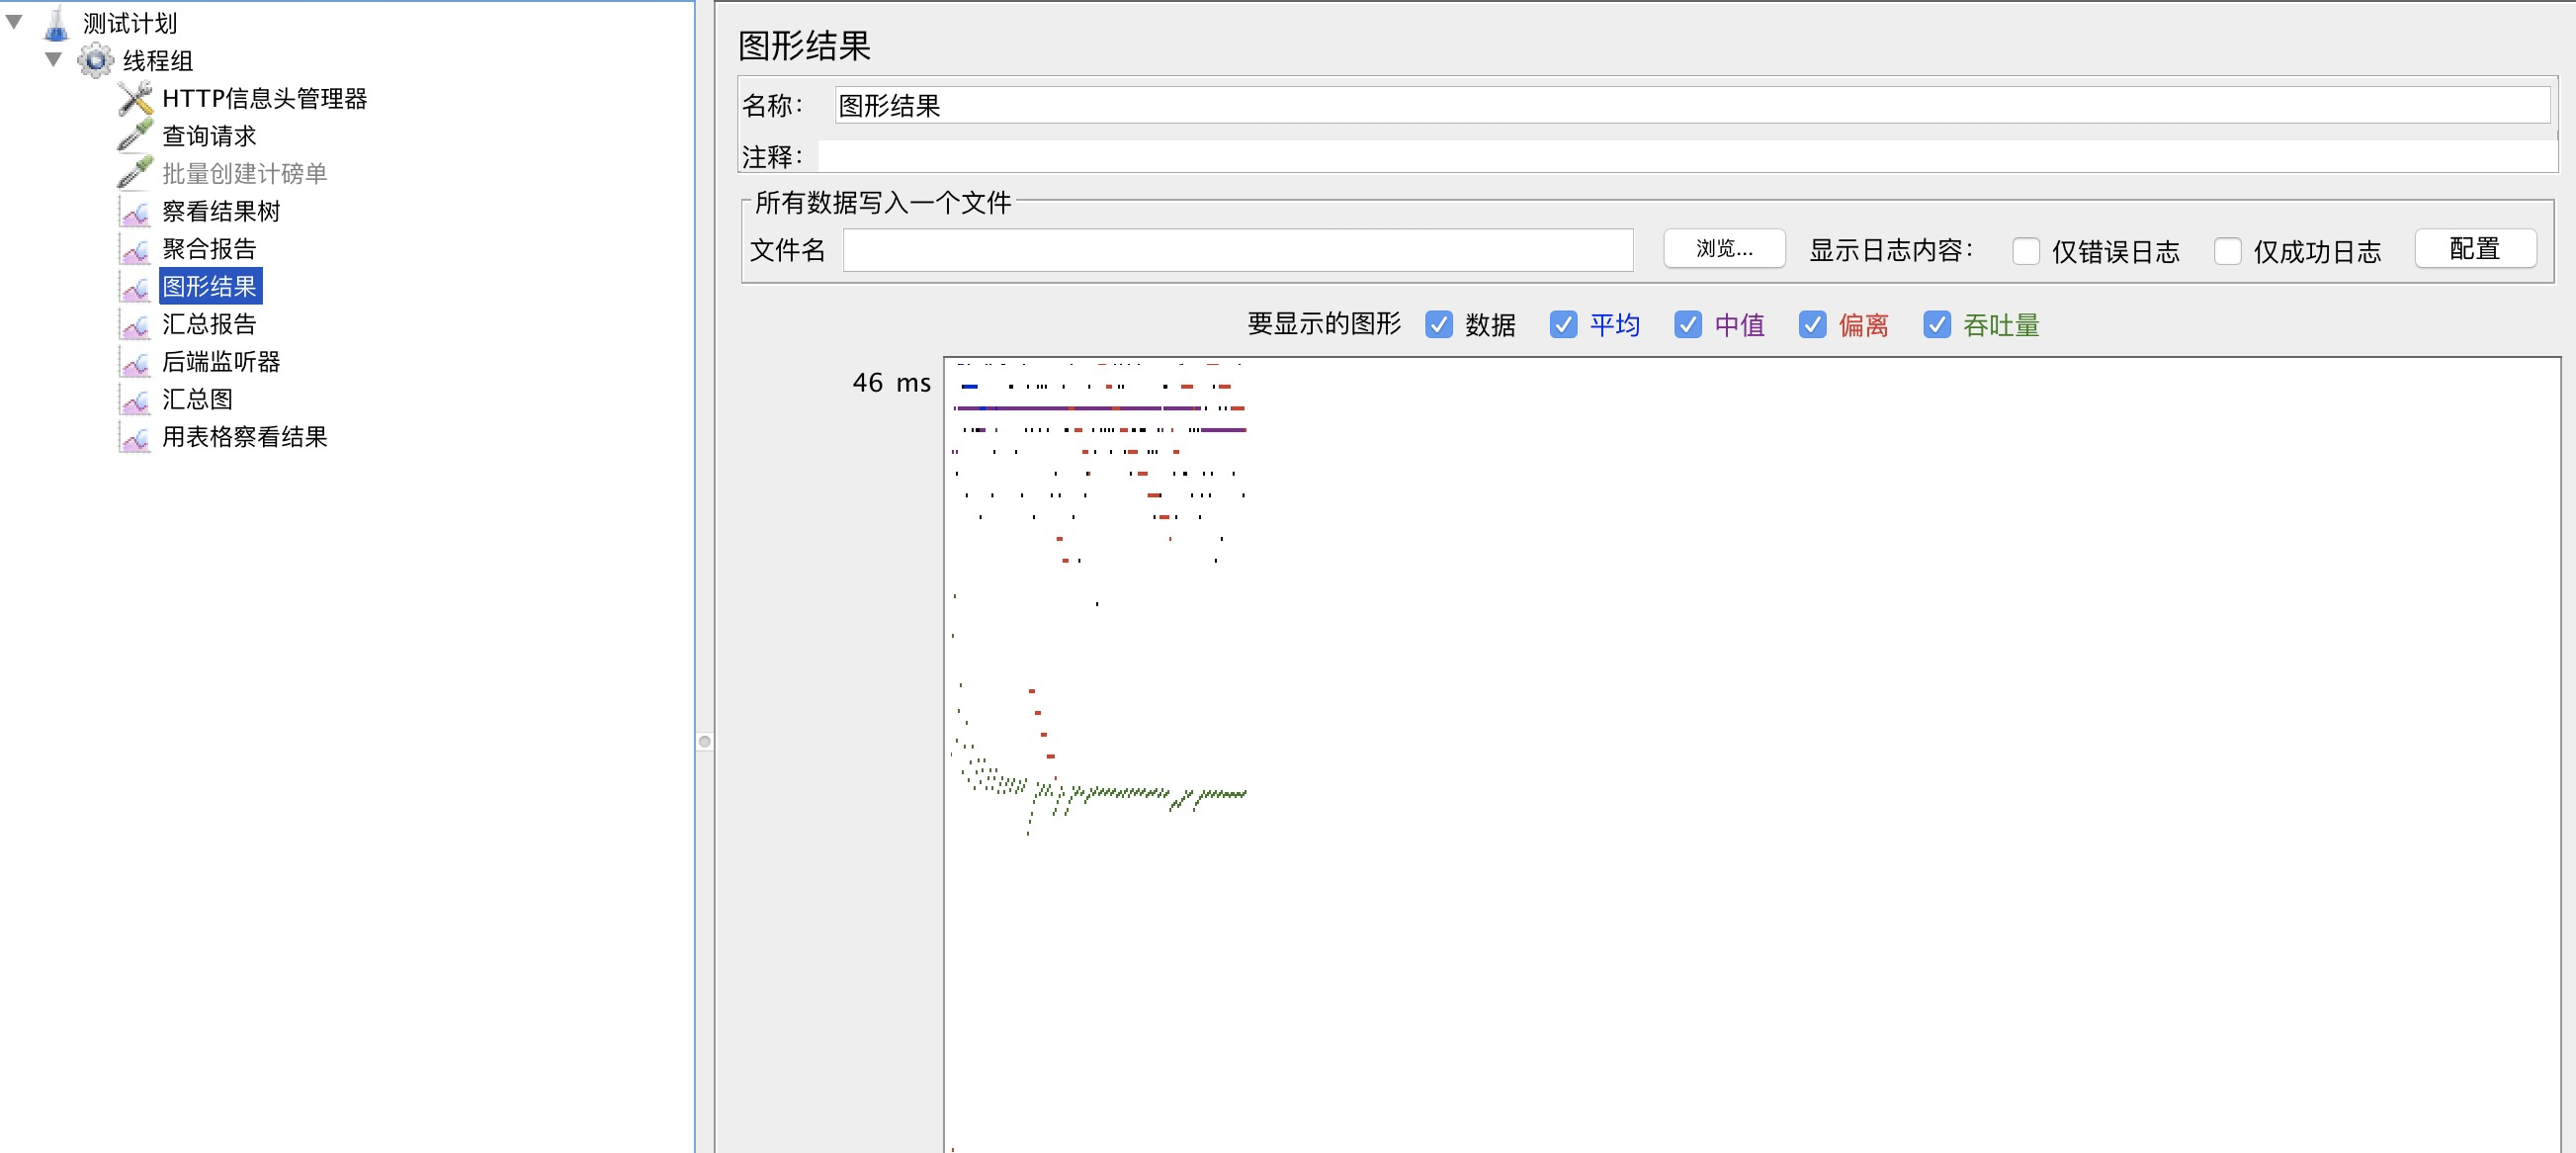
用表格查看结果:

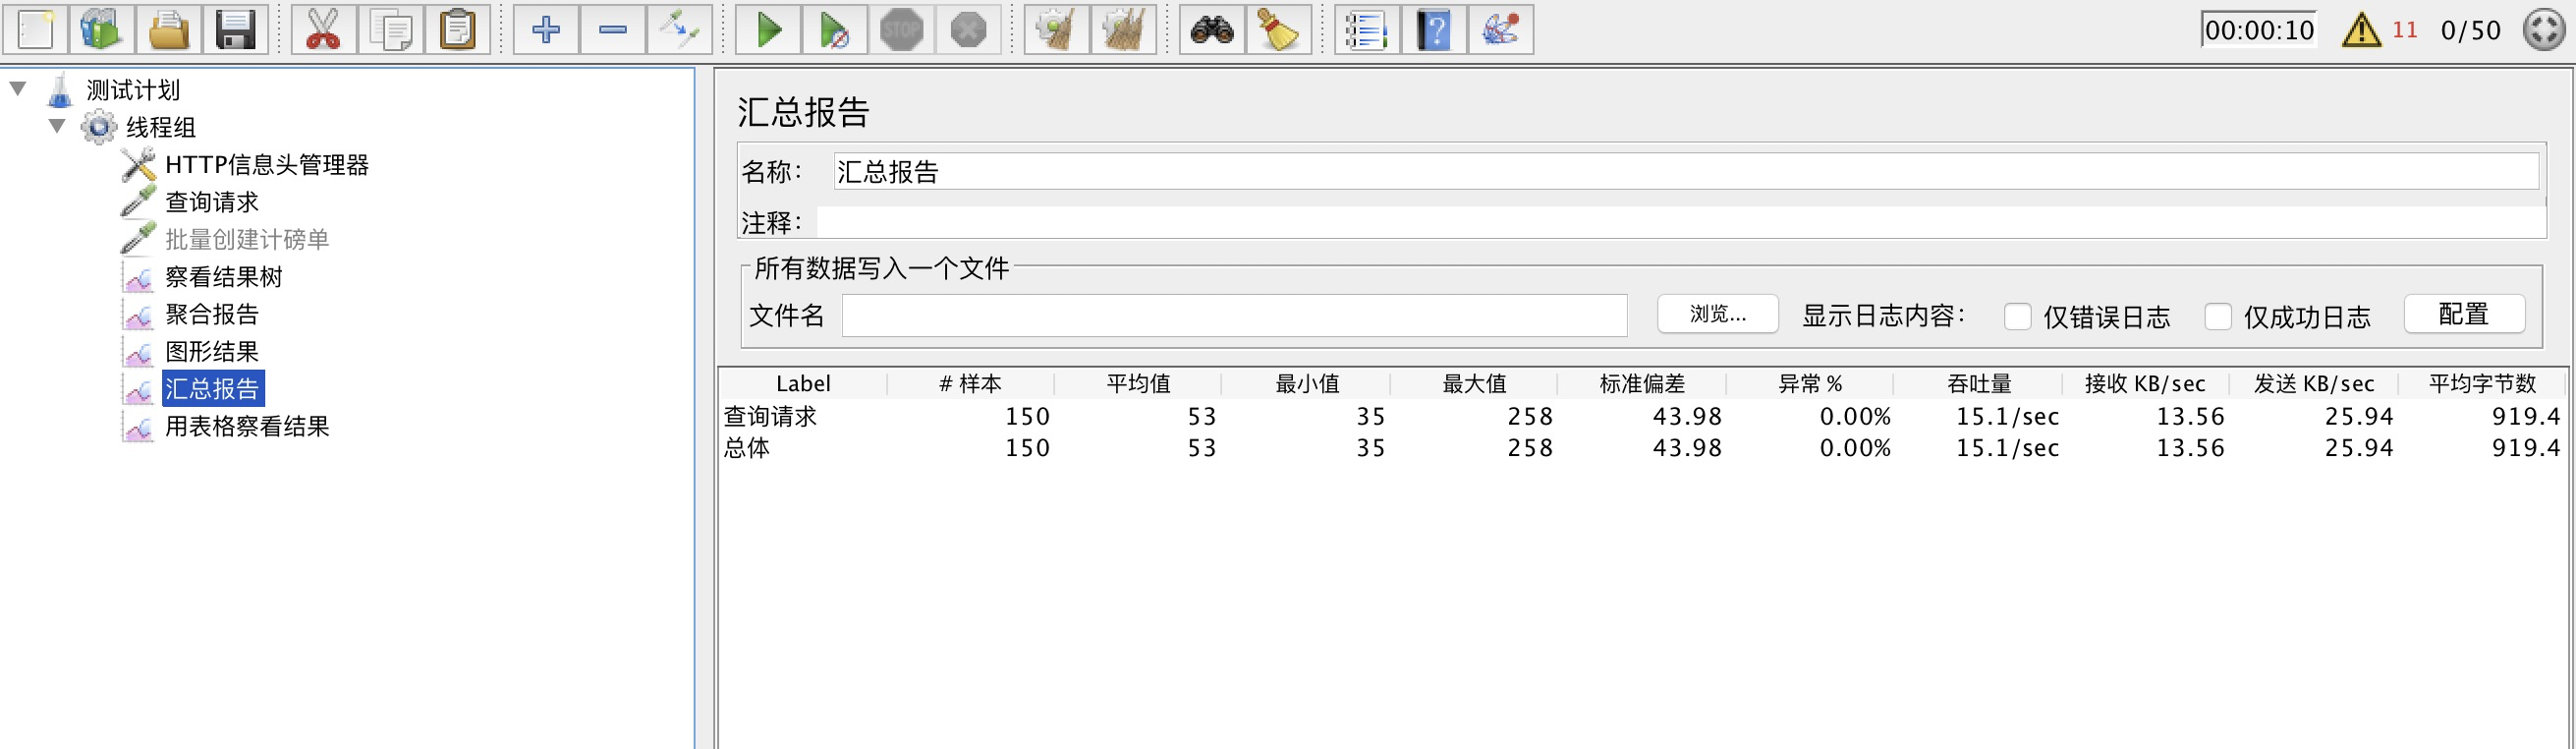
汇总报告:
三、附录 返回目录
感谢Skye Lin的文章:《jmeter进行带token的测试》