Python人工智能参考---线性回归(Linear Regression)
一、总结
一句话总结:
线性回归是回归问题中的一种,线性回归假设目标值与特征之间线性相关,即满足一个多元一次方程。y=wx+b
1、什么是回归分析?
a、【研究因变量和自变量之间的关系】:回归分析是一种预测性的建模技术,它研究的是因变量(目标)和自变量(预测器)之间的关系。
b、【预测分析】:这种技术通常用于预测分析,时间序列模型以及发现变量之间的因果关系。
c、【曲线拟合点】:通常使用曲线/线来拟合数据点,目标是使曲线到数据点的距离差异最小。
2、求解线性回归损失函数的两种方式?
最小二乘法(least square method):求解 w 和 b 是使损失函数最小化的过程,在统计中,称为线性回归模型的最小二乘“参数估计”(parameter estimation)。
梯度下降(gradient descent):梯度下降核心内容是对自变量进行不断的更新(针对w和b求偏导),使得目标函数不断逼近最小值的过程
3、线性回归解决问题实例?
数据可以映射到坐标轴(二维或多维)上面形成一些点,线性回归就可以用曲线来模拟这些点,从而根据曲线来预测结果
二、机器学习 | 算法笔记- 线性回归(Linear Regression)
转自或参考:机器学习 | 算法笔记- 线性回归(Linear Regression) - eo_will - 博客园
https://www.cnblogs.com/geo-will/p/10468253.html
前言
本系列为机器学习算法的总结和归纳,目的为了清晰阐述算法原理,同时附带上手代码实例,便于理解。
本章为线性回归,内容包括模型介绍及代码实现(包括自主实现和sklearn案例)。
一、算法简介
1.1 什么是回归分析
回归分析是一种预测性的建模技术,它研究的是因变量(目标)和自变量(预测器)之间的关系。这种技术通常用于预测分析,时间序列模型以及发现变量之间的因果关系。通常使用曲线/线来拟合数据点,目标是使曲线到数据点的距离差异最小。
1.2 线性回归
线性回归是回归问题中的一种,线性回归假设目标值与特征之间线性相关,即满足一个多元一次方程。通过构建损失函数,来求解损失函数最小时的参数w和b。通长我们可以表达成如下公式:
y^为预测值,自变量x和因变量y是已知的,而我们想实现的是预测新增一个x,其对应的y是多少。因此,为了构建这个函数关系,目标是通过已知数据点,求解线性模型中w和b两个参数。
1.3 目标/损失函数
求解最佳参数,需要一个标准来对结果进行衡量,为此我们需要定量化一个目标函数式,使得计算机可以在求解过程中不断地优化。
针对任何模型求解问题,都是最终都是可以得到一组预测值y^ ,对比已有的真实值 y ,数据行数为 n ,可以将损失函数定义如下:
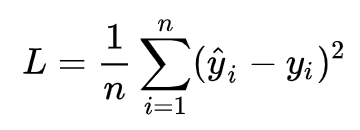
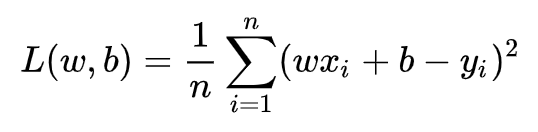
即预测值与真实值之间的平均的平方距离,统计中一般称其为MAE(mean square error)均方误差。把之前的函数式代入损失函数,并且将需要求解的参数w和b看做是函数L的自变量,可得
现在的任务是求解最小化L时w和b的值,
即核心目标优化式为

求解方式有两种:
1)最小二乘法(least square method)
求解 w 和 b 是使损失函数最小化的过程,在统计中,称为线性回归模型的最小二乘“参数估计”(parameter estimation)。我们可以将 L(w,b) 分别对 w 和 b 求导,得到
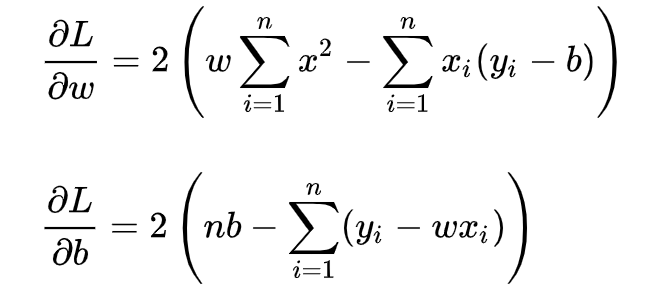
令上述两式为0,可得到 w 和 b 最优解的闭式(closed-form)解:

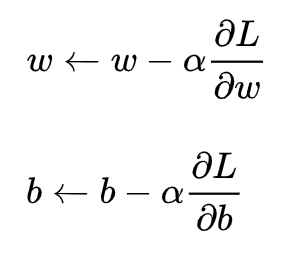
2)梯度下降(gradient descent)
梯度下降核心内容是对自变量进行不断的更新(针对w和b求偏导),使得目标函数不断逼近最小值的过程
这里不做展开讲解。
二、代码实现
2.1 简单线性回归
首先建立linear_regression.py文件,用于实现线性回归的类文件,包含了线性回归内部的核心函数:
 View Code
View Code
View Code

# -*- coding: utf-8 -*-

import numpy as np


class LinerRegression(object):

    def __init__(self, learning_rate=0.01, max_iter=100, seed=None):
        np.random.seed(seed)
        self.lr = learning_rate
        self.max_iter = max_iter
        self.w = np.random.normal(1, 0.1)
        self.b = np.random.normal(1, 0.1)
        self.loss_arr = []

    def fit(self, x, y):
        self.x = x
        self.y = y
        for i in range(self.max_iter):
            self._train_step()
            self.loss_arr.append(self.loss())
            # print('loss: 	{:.3}'.format(self.loss()))
            # print('w: 	{:.3}'.format(self.w))
            # print('b: 	{:.3}'.format(self.b))

    def _f(self, x, w, b):
        return x * w + b

    def predict(self, x=None):
        if x is None:
            x = self.x
        y_pred = self._f(x, self.w, self.b)
        return y_pred

    def loss(self, y_true=None, y_pred=None):
        if y_true is None or y_pred is None:
            y_true = self.y
            y_pred = self.predict(self.x)
        return np.mean((y_true - y_pred)**2)

    def _calc_gradient(self):
        d_w = np.mean((self.x * self.w + self.b - self.y) * self.x)
        d_b = np.mean(self.x * self.w + self.b - self.y)
        return d_w, d_b

    def _train_step(self):
        d_w, d_b = self._calc_gradient()
        self.w = self.w - self.lr * d_w
        self.b = self.b - self.lr * d_b
        return self.w, self.b
建立 train.py 文件,用于生成模拟数据,并调用 liner_regression.py 中的类,完成线性回归任务:
# -*- coding: utf-8 -*-

import numpy as np
import matplotlib.pyplot as plt
from liner_regression import *


def show_data(x, y, w=None, b=None):
    plt.scatter(x, y, marker='.')
    if w is not None and b is not None:
        plt.plot(x, w*x+b, c='red')
    plt.show()


# data generation
np.random.seed(272)
data_size = 100
x = np.random.uniform(low=1.0, high=10.0, size=data_size)
y = x * 20 + 10 + np.random.normal(loc=0.0, scale=10.0, size=data_size)

# plt.scatter(x, y, marker='.')
# plt.show()

# train / test split
shuffled_index = np.random.permutation(data_size)
x = x[shuffled_index]
y = y[shuffled_index]
split_index = int(data_size * 0.7)
x_train = x[:split_index]
y_train = y[:split_index]
x_test = x[split_index:]
y_test = y[split_index:]

# visualize data
# plt.scatter(x_train, y_train, marker='.')
# plt.show()
# plt.scatter(x_test, y_test, marker='.')
# plt.show()

# train the liner regression model
regr = LinerRegression(learning_rate=0.01, max_iter=10, seed=314)
regr.fit(x_train, y_train)
print('cost: 	{:.3}'.format(regr.loss()))
print('w: 	{:.3}'.format(regr.w))
print('b: 	{:.3}'.format(regr.b))
show_data(x, y, regr.w, regr.b)

# plot the evolution of cost
plt.scatter(np.arange(len(regr.loss_arr)), regr.loss_arr, marker='o', c='green')
plt.show()
2.2 sklearn实现
sklearn.linear_model提供了很多线性模型,包括岭回归、贝叶斯回归、Lasso等。本文主要尝试使用岭回归Ridge,该函数一共有8个参数,详见
View Code
岭回归是缩减法的一种,相当于对回归系数的大小施加了限制。另一种很好的缩减法是lasso。lasso难以求解,但可以使用计算简便的逐步线性回归方法求的近似解。
# -*-coding:utf-8 -*-
import numpy as np
from bs4 import BeautifulSoup
import random

def scrapePage(retX, retY, inFile, yr, numPce, origPrc):
    """
    函数说明:从页面读取数据,生成retX和retY列表
    Parameters:
        retX - 数据X
        retY - 数据Y
        inFile - HTML文件
        yr - 年份
        numPce - 乐高部件数目
        origPrc - 原价
    Returns:
        无
    """
    # 打开并读取HTML文件
    with open(inFile, encoding='utf-8') as f:
        html = f.read()
    soup = BeautifulSoup(html)

    i = 1
    # 根据HTML页面结构进行解析
    currentRow = soup.find_all('table', r = "%d" % i)

    while(len(currentRow) != 0):
        currentRow = soup.find_all('table', r = "%d" % i)
        title = currentRow[0].find_all('a')[1].text
        lwrTitle = title.lower()
        # 查找是否有全新标签
        if (lwrTitle.find('new') > -1) or (lwrTitle.find('nisb') > -1):
            newFlag = 1.0
        else:
            newFlag = 0.0

        # 查找是否已经标志出售,我们只收集已出售的数据
        soldUnicde = currentRow[0].find_all('td')[3].find_all('span')
        if len(soldUnicde) == 0:
            print("商品 #%d 没有出售" % i)
        else:
            # 解析页面获取当前价格
            soldPrice = currentRow[0].find_all('td')[4]
            priceStr = soldPrice.text
            priceStr = priceStr.replace('$','')
            priceStr = priceStr.replace(',','')
            if len(soldPrice) > 1:
                priceStr = priceStr.replace('Free shipping', '')
            sellingPrice = float(priceStr)

            # 去掉不完整的套装价格
            if  sellingPrice > origPrc * 0.5:
                print("%d	%d	%d	%f	%f" % (yr, numPce, newFlag, origPrc, sellingPrice))
                retX.append([yr, numPce, newFlag, origPrc])
                retY.append(sellingPrice)
        i += 1
        currentRow = soup.find_all('table', r = "%d" % i)

def ridgeRegres(xMat, yMat, lam = 0.2):
    """
    函数说明:岭回归
    Parameters:
        xMat - x数据集
        yMat - y数据集
        lam - 缩减系数
    Returns:
        ws - 回归系数
    """
    xTx = xMat.T * xMat
    denom = xTx + np.eye(np.shape(xMat)[1]) * lam
    if np.linalg.det(denom) == 0.0:
        print("矩阵为奇异矩阵,不能求逆")
        return
    ws = denom.I * (xMat.T * yMat)
    return ws

def setDataCollect(retX, retY):
    """
    函数说明:依次读取六种乐高套装的数据,并生成数据矩阵
    Parameters:
        无
    Returns:
        无

    """
    scrapePage(retX, retY, './lego/lego8288.html', 2006, 800, 49.99)                #2006年的乐高8288,部件数目800,原价49.99
    scrapePage(retX, retY, './lego/lego10030.html', 2002, 3096, 269.99)                #2002年的乐高10030,部件数目3096,原价269.99
    scrapePage(retX, retY, './lego/lego10179.html', 2007, 5195, 499.99)                #2007年的乐高10179,部件数目5195,原价499.99
    scrapePage(retX, retY, './lego/lego10181.html', 2007, 3428, 199.99)                #2007年的乐高10181,部件数目3428,原价199.99
    scrapePage(retX, retY, './lego/lego10189.html', 2008, 5922, 299.99)                #2008年的乐高10189,部件数目5922,原价299.99
    scrapePage(retX, retY, './lego/lego10196.html', 2009, 3263, 249.99)                #2009年的乐高10196,部件数目3263,原价249.99

def regularize(xMat, yMat):
    """
    函数说明:数据标准化
    Parameters:
        xMat - x数据集
        yMat - y数据集
    Returns:
        inxMat - 标准化后的x数据集
        inyMat - 标准化后的y数据集

    """
    inxMat = xMat.copy()                                                        #数据拷贝
    inyMat = yMat.copy()
    yMean = np.mean(yMat, 0)                                                    #行与行操作,求均值
    inyMat = yMat - yMean                                                        #数据减去均值
    inMeans = np.mean(inxMat, 0)                                                   #行与行操作,求均值
    inVar = np.var(inxMat, 0)                                                     #行与行操作,求方差
    # print(inxMat)
    print(inMeans)
    # print(inVar)
    inxMat = (inxMat - inMeans) / inVar                                            #数据减去均值除以方差实现标准化
    return inxMat, inyMat

def rssError(yArr,yHatArr):
    """
    函数说明:计算平方误差
    Parameters:
        yArr - 预测值
        yHatArr - 真实值
    Returns:


    """
    return ((yArr-yHatArr)**2).sum()

def standRegres(xArr,yArr):
    """
    函数说明:计算回归系数w
    Parameters:
        xArr - x数据集
        yArr - y数据集
    Returns:
        ws - 回归系数

    """
    xMat = np.mat(xArr); yMat = np.mat(yArr).T
    xTx = xMat.T * xMat                            #根据文中推导的公示计算回归系数
    if np.linalg.det(xTx) == 0.0:
        print("矩阵为奇异矩阵,不能求逆")
        return
    ws = xTx.I * (xMat.T*yMat)
    return ws

def crossValidation(xArr, yArr, numVal = 10):
    """
    函数说明:交叉验证岭回归
    Parameters:
        xArr - x数据集
        yArr - y数据集
        numVal - 交叉验证次数
    Returns:
        wMat - 回归系数矩阵

    """
    m = len(yArr)                                                                        #统计样本个数
    indexList = list(range(m))                                                            #生成索引值列表
    errorMat = np.zeros((numVal,30))                                                    #create error mat 30columns numVal rows
    for i in range(numVal):                                                                #交叉验证numVal次
        trainX = []; trainY = []                                                        #训练集
        testX = []; testY = []                                                            #测试集
        random.shuffle(indexList)                                                        #打乱次序
        for j in range(m):                                                                #划分数据集:90%训练集,10%测试集
            if j < m * 0.9:
                trainX.append(xArr[indexList[j]])
                trainY.append(yArr[indexList[j]])
            else:
                testX.append(xArr[indexList[j]])
                testY.append(yArr[indexList[j]])
        wMat = ridgeTest(trainX, trainY)                                                #获得30个不同lambda下的岭回归系数
        for k in range(30):                                                                #遍历所有的岭回归系数
            matTestX = np.mat(testX); matTrainX = np.mat(trainX)                        #测试集
            meanTrain = np.mean(matTrainX,0)                                            #测试集均值
            varTrain = np.var(matTrainX,0)                                                #测试集方差
            matTestX = (matTestX - meanTrain) / varTrain                                 #测试集标准化
            yEst = matTestX * np.mat(wMat[k,:]).T + np.mean(trainY)                        #根据ws预测y值
            errorMat[i, k] = rssError(yEst.T.A, np.array(testY))                            #统计误差
    meanErrors = np.mean(errorMat,0)                                                    #计算每次交叉验证的平均误差
    minMean = float(min(meanErrors))                                                    #找到最小误差
    bestWeights = wMat[np.nonzero(meanErrors == minMean)]                                #找到最佳回归系数

    xMat = np.mat(xArr); yMat = np.mat(yArr).T
    meanX = np.mean(xMat,0); varX = np.var(xMat,0)
    unReg = bestWeights / varX                                                            #数据经过标准化,因此需要还原
    print('%f%+f*年份%+f*部件数量%+f*是否为全新%+f*原价' % ((-1 * np.sum(np.multiply(meanX,unReg)) + np.mean(yMat)), unReg[0,0], unReg[0,1], unReg[0,2], unReg[0,3]))

def ridgeTest(xArr, yArr):
    """
    函数说明:岭回归测试
    Parameters:
        xMat - x数据集
        yMat - y数据集
    Returns:
        wMat - 回归系数矩阵

    """
    xMat = np.mat(xArr); yMat = np.mat(yArr).T
    #数据标准化
    yMean = np.mean(yMat, axis = 0)                        #行与行操作,求均值
    yMat = yMat - yMean                                    #数据减去均值
    xMeans = np.mean(xMat, axis = 0)                    #行与行操作,求均值
    xVar = np.var(xMat, axis = 0)                        #行与行操作,求方差
    xMat = (xMat - xMeans) / xVar                        #数据减去均值除以方差实现标准化
    numTestPts = 30                                        #30个不同的lambda测试
    wMat = np.zeros((numTestPts, np.shape(xMat)[1]))    #初始回归系数矩阵
    for i in range(numTestPts):                            #改变lambda计算回归系数
        ws = ridgeRegres(xMat, yMat, np.exp(i - 10))    #lambda以e的指数变化,最初是一个非常小的数,
        wMat[i, :] = ws.T                                 #计算回归系数矩阵
    return wMat

def useStandRegres():
    """
    函数说明:使用简单的线性回归
    Parameters:
        无
    Returns:
        无

    """
    lgX = []
    lgY = []
    setDataCollect(lgX, lgY)
    data_num, features_num = np.shape(lgX)
    lgX1 = np.mat(np.ones((data_num, features_num + 1)))
    lgX1[:, 1:5] = np.mat(lgX)
    ws = standRegres(lgX1, lgY)
    print('%f%+f*年份%+f*部件数量%+f*是否为全新%+f*原价' % (ws[0],ws[1],ws[2],ws[3],ws[4]))

def usesklearn():
    """
    函数说明:使用sklearn
    Parameters:
        无
    Returns:
        无

    """
    from sklearn import linear_model
    reg = linear_model.Ridge(alpha = .5)
    lgX = []
    lgY = []
    setDataCollect(lgX, lgY)
    reg.fit(lgX, lgY)
    print('%f%+f*年份%+f*部件数量%+f*是否为全新%+f*原价' % (reg.intercept_, reg.coef_[0], reg.coef_[1], reg.coef_[2], reg.coef_[3]))

if __name__ == '__main__':
    usesklearn()