matplotlib_200730系列---5、Annotation标注
一、总结
一句话总结:
1、plt的annotate方法添加标注,plt的text方法添加文本标注
2、虚线用plot方法画,scatter方法来标注点
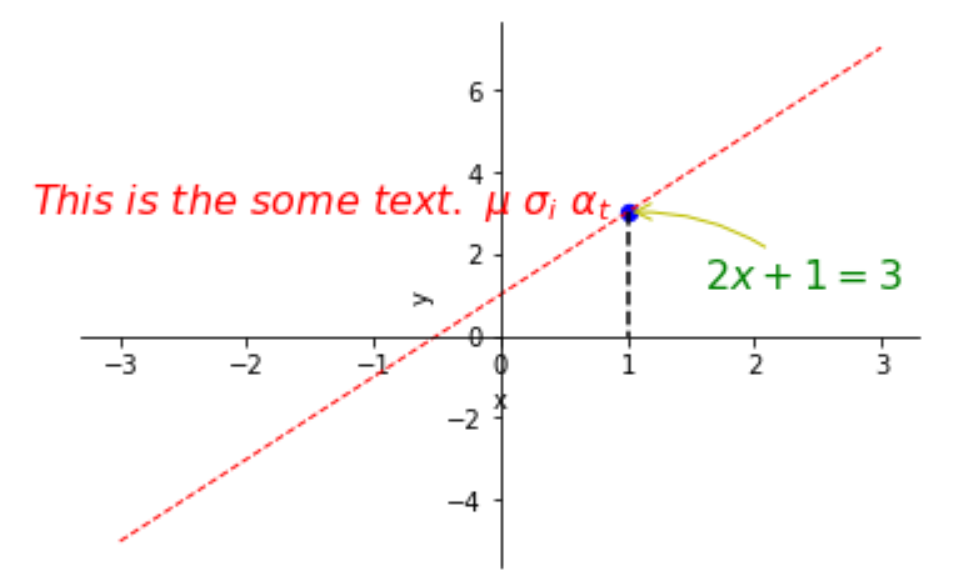
# 添加标注
# 1、画虚线,也就是两个点
x0=1
y0=2*x0+1
# 2、用scatter的方式把点给画了
plt.scatter(x0,y0,s=40,color='b')
# k是黑色,--是虚线,lw是line width
plt.plot([x0,x0],[y0,0],'k--',lw=1.5)

# 添加annotate标注
###################################
# xytext=(+30,-30) 位置是 x0、y0 点(+30,-30)的位置
# arrowprops表示箭头属性
plt.annotate(r'$2x+1=%s$'% y0,color="g",xy=(x0,y0),
             xycoords='data', xytext=(+30,-30),
             textcoords='offset points', fontsize=16,
             arrowprops=dict(arrowstyle='->',color="y" ,connectionstyle='arc3, rad=.2'))

# 添加text标注
###################################
plt.text(-3.7,3,r'$This is the some text. mu sigma_i alpha_t$', fontdict={'size':16,'color':'r'})
二、Annotation标注
博客对应课程的视频位置:
import matplotlib.pyplot as plt
import numpy as np
x=np.linspace(-3,3,50)
y1=2*x+1

plt.figure()
plt.plot(x, y1, color='red', linewidth=1, linestyle='--')

plt.xlabel("x")
plt.ylabel("y")

# gca='get current axis'
ax=plt.gca()
# 将右和上的轴去掉
ax.spines['right'].set_color('none')
ax.spines['top'].set_color('none')
# 将bottom轴设置为x轴
ax.xaxis.set_ticks_position('bottom')
# 将left轴设置为y轴
ax.yaxis.set_ticks_position('left')
# 将x轴设置在y=0的位置
ax.spines['bottom'].set_position(('data',0))
# 将y轴设置为x=0的位置
ax.spines['left'].set_position(('data',0))

# 添加标注
# 1、画虚线,也就是两个点
x0=1
y0=2*x0+1
# 2、用scatter的方式把点给画了
plt.scatter(x0,y0,s=40,color='b')
# k是黑色,--是虚线,lw是line width
plt.plot([x0,x0],[y0,0],'k--',lw=1.5)

# 添加annotate标注
###################################
# xytext=(+30,-30) 位置是 x0、y0 点(+30,-30)的位置
# arrowprops表示箭头属性
plt.annotate(r'$2x+1=%s$'% y0,color="g",xy=(x0,y0),
             xycoords='data', xytext=(+30,-30),
             textcoords='offset points', fontsize=16,
             arrowprops=dict(arrowstyle='->',color="y" ,connectionstyle='arc3, rad=.2'))

# 添加text标注
###################################
plt.text(-3.7,3,r'$This is the some text. mu sigma_i alpha_t$', fontdict={'size':16,'color':'r'})

plt.show()