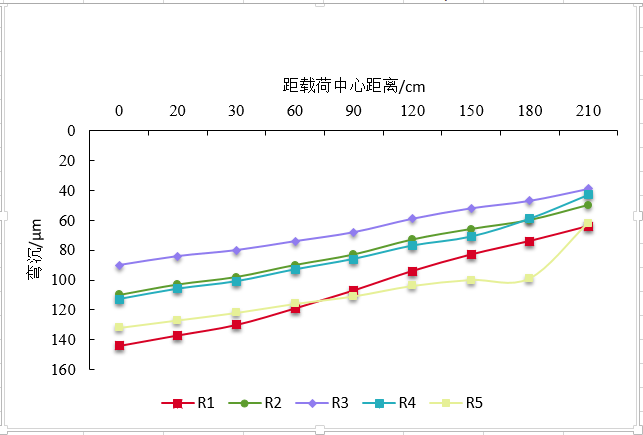
chart.x_axis.title = title_maker_x('距载荷中心距离/cm')
    chart.y_axis.title = title_maker_y('弯沉/μm')
    # 修改坐标值的位置
    # ['high', 'low', 'nextTo']
    # chart.y_axis.tickLblPos = 'high'
    # 控制坐标轴的位置
    # ['autoZero', 'max', 'min']
    # chart.y_axis.crosses = 'min'
    # 从左向右边移动坐标轴
    # chart.y_axis.crossesAt = 5
    # ['b', 'l', 'r', 't']
    # chart.y_axis.axPos = 't'
    chart.style = 10
    # 布局
    chart.layout = char_Layout()
    chart.legend.position = 'b'
    # chart.legend.layout = leng_layout()
    # chart.legend.overlay = True

    # chart.x_axis = DateAxis(crossAx=100)
    # 去除图形边框
    chart.graphical_properties = GraphicalProperties(ln=LineProperties(noFill=True))
    if row_num > 10:
        chart.height = 9 + int(row_num // 5) * 2
        chart.width = 13.4 + int(row_num // 5) * 2
    else:
        chart.height = 9
        chart.width = 13.4

    chart.add_data(data, titles_from_data=True, from_rows=True)
    chart.set_categories(titles)
    chart.graphical_properties = GraphicalProperties(ln=LineProperties(noFill=True))
    # chart.graphical_properties.line.width = 12700

    # 去除x,y,z线条
    chart.y_axis.majorGridlines = None
    # 或者
    # chart.y_axis.majorGridlines.spPr = GraphicalProperties(noFill=True)
    # chart.y_axis.majorGridlines.spPr.ln = LineProperties(solidFill='ffffff')
    # 刻度线的显示位置
    chart.y_axis.majorTickMark = 'in'  # ['cross:俩边', 'in:内', 'out:外'] 不设没有
    chart.x_axis.majorTickMark = 'in'  # ['cross:俩边', 'in:内', 'out:外'] 不设没有
    # 坐标轴的颜色
    chart.y_axis.spPr = GraphicalProperties(noFill=True)
    chart.y_axis.spPr.ln = LineProperties(solidFill='000000')
    chart.x_axis.spPr = GraphicalProperties(noFill=True)
    chart.x_axis.spPr.ln = LineProperties(solidFill='000000')
    font_test = Font(typeface='Times New Roman')
    # cp = CharacterProperties(latin=font_test, sz=1500)
    cp = CharacterProperties(latin=font_test)
    chart.y_axis.textProperties = RichText(p=[Paragraph(pPr=ParagraphProperties(defRPr=cp), endParaRPr=cp)])
    chart.x_axis.textProperties = RichText(p=[Paragraph(pPr=ParagraphProperties(defRPr=cp), endParaRPr=cp)])
    chart.y_axis.scaling.orientation = 'maxMin'  # 设置轴线方向 从大到小

    # chart.graphicalProperties.line.width = 100050
    alleries = chart.series
    # chart.marker = True
    img_ma = [
        'circle', 'diamond', 'square', 'triangle', 'x',
        # 'star','plus','auto', 'dash', 'dot',
    ]
    # chart.dLbls = DataLabelList()
    # chart.dLbls.showCatName = True  # 标签显示
    # chart.dLbls.showVal = True  # 数量显示
    # chart.dLbls.showPercent = True  # 百分比显示
    len_img_ma = len(img_ma)
    chars = '0123456789ABCDEF'

    all_color = [''.join(random.sample(chars, 6)) for i in range(len(alleries))]
    for index, ser in enumerate(alleries):
        ser.graphicalProperties.line.width = 12700
        # 平滑
        ser.smooth = True
        ser.marker.symbol = img_ma[int(index % len_img_ma)]
        ser.marker.size = 5
        # 添加标记
        # (['circle', 'dash', 'diamond', 'dot', 'picture',
        #                               'plus', 'square', 'star', 'triangle', 'x', 'auto']),
        # ser.marker.symbol = "x"
        # 标记内为颜色
        # ser.marker.graphicalProperties.solidFill = all_color[index] # Marker filling
        ser.marker.graphicalProperties.noFill = True  # 无填充
        # 标记框颜色
        ser.marker.graphicalProperties.line.solidFill = all_color[index]  # Marker outline
        # 控制是否显示线
        # ser.graphicalProperties.line.noFill = True
        ser.graphicalProperties.line.solidFill = all_color[index]

    anchor = 'L' + str(1 + img_postion_num * 20)
    ws.add_chart(chart, anchor)