以下内容引用链接:https://blog.csdn.net/baidu_37352210/article/details/79596633
(注意:通过如下内容可知,将序列信号进行傅里叶变换后,得到的频谱图上各k值(1~N/2)对应的振幅,观察主要振幅,并得到其信号主要分量的周期N/k)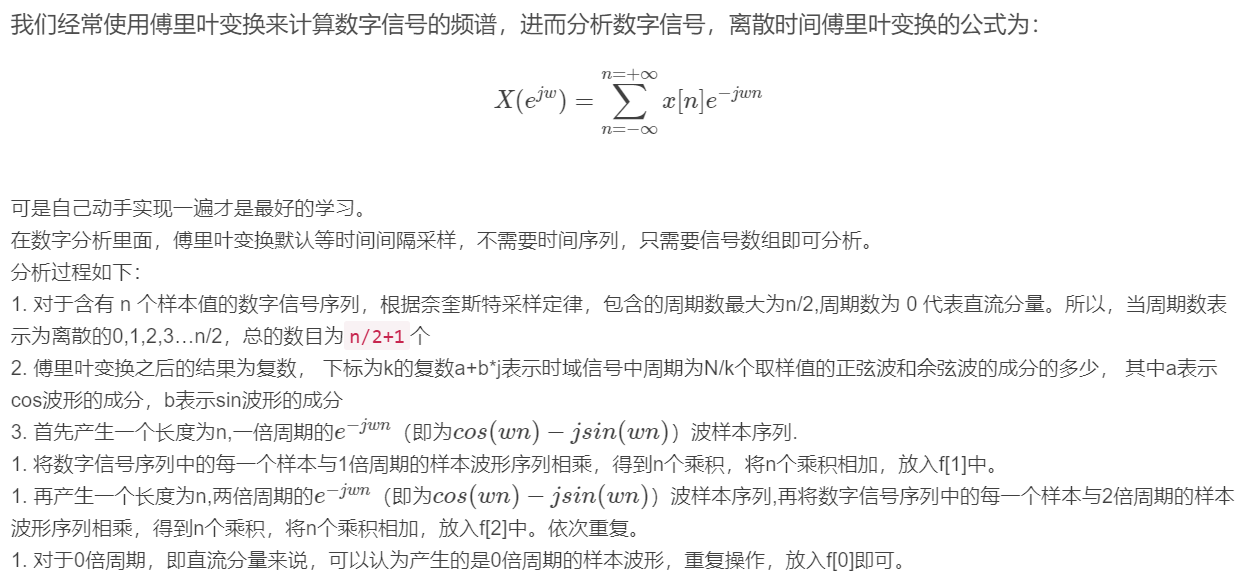

# 离散时间傅里叶变换的python实现
import numpy as np
import math
import pylab as pl
import scipy.signal as signal
import matplotlib.pyplot as plt
sampling_rate=1000
t1=np.arange(0, 10.0, 1.0/sampling_rate)
x1 =np.sin(15*np.pi*t1)
# 傅里叶变换
def fft1(xx):
# t=np.arange(0, s)
t=np.linspace(0, 1.0, len(xx))
f = np.arange(len(xx)/2+1, dtype=complex)
for index in range(len(f)):
f[index]=complex(np.sum(np.cos(2*np.pi*index*t)*xx), -np.sum(np.sin(2*np.pi*index*t)*xx))
return f
# len(x1)
xf=fft1(x1)/len(x1)
freqs = np.linspace(0, sampling_rate/2, len(x1)/2+1)
plt.figure(figsize=(16,4))
plt.plot(freqs,2*np.abs(xf),'r--')
plt.xlabel("Frequency(Hz)")
plt.ylabel("Amplitude($m$)")
plt.title("Amplitude-Frequency curve")
plt.show()
plt.figure(figsize=(16,4))
plt.plot(freqs,2*np.abs(xf),'r--')
plt.xlabel("Frequency(Hz)")
plt.ylabel("Amplitude($m$)")
plt.title("Amplitude-Frequency curve")
plt.xlim(0,20)
plt.show()
此处实现的是传统的傅里叶变换,这种方法实际已经不用了,现在使用快速傅里叶变换,其实两种是等价的,但是快速傅里叶变换时间复杂度要小很多。