1.数据库
- Dataset1.txt:328个同学的身高、体重、性别数据(78个女生250个男生)
- Dataset2.txt:124个同学的数据(40女、84男)
- Dataset3.txt:90个同学的数据(16女,74男)
数据集:提取码:e8ph
2.需要完成的工作
(1)以dataset1为训练数据库,假设身高与体重满足高斯分布,进行高斯分布的参数估计,并进行基于最小错误率的贝叶斯分类,分别考虑男女的先验概率,0.5-0.5;0.6-0.4;0.7-0.3,0.8-0.2,并以dataset2和dataset3为测试数据库分析分类性能,并探讨先验概率对分类性能的影响。
(2)以dataset1为训练数据库,进行基于pazen窗方法的概率密度估计,并进行0.5-0.5先验概率条件下的最小错误率并进行基于最小错误率的贝叶斯分类并以dataset2和dataset3为测试数据库分析分类性能。
(3)基于线性分类器进行性别分类,同样以dataset1作为训练样本,dataset2和dataset3作为测试样本。
3.方法与思路
由前两问可以看出,其实判别的函数就是下图,就是给定一个待测向量X,它是类别Wi的概率。
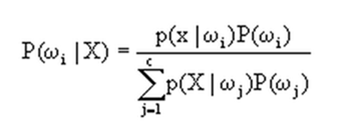
先验概率p(wi)和类条件概率p(xlwi)都是未知的。根据仅有的样本数据进行分类时,一种可行的办法是我们需要先对先验概率和类条件概率进行估计,然后再套用贝叶斯分类器。
先验概率的估计较简单:
- 每个样本所属的自然状态都是已知的(有监督学习);
- 依靠经验;
- 用训练样本中各类出现的频率估计。
类条件概率的估计(非常难),原因包括:
- 概率密度函数包含了一个随机变量的全部信息;
- 概率密度函数可以是满足p(x)≥0;fp(x)dx=1的任何函数;
- 在很多情况下,已有的训练样本数总是太少;
- 当用于表示特征的向量x的维数较大时,就会产生严重的计算复杂度问题(算法的执行时间,系统资源开销等)。
这里讨论的主要是对类条件概率的估计。估计的方法分为两大类:
参数估计(parametric):
参数估计法,样本所属的类别和类条件概率密度函数形式已知,而表征概率密度函数的某些参数是未知的。要求由已知类别的训练数据样本集,对概率密度的某些参数进行统计估计。如:最大似然估计,贝叶斯估计等。
思路:x->0->p(xlwi),将概率密度估计转化为参数估计对于本次作业来说,我们假设类条件概率密度的函数形式是高斯型,第一想法的是下列式子:
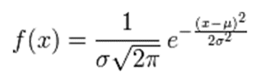
然而,上面常见的高斯概率密度函数只是针对一维的参数X,对于大多数情况,输入参数会是多维的,这里我们针对二元变量的概率密度函数求解为:
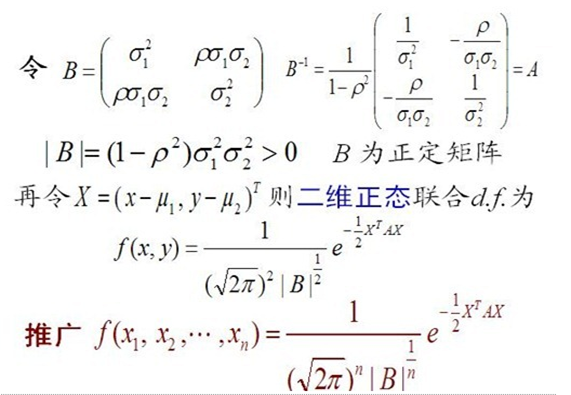
说明:上边的参数p是多变量间的相关系数,设定值应小于1。
非参数估计(non-parametric):
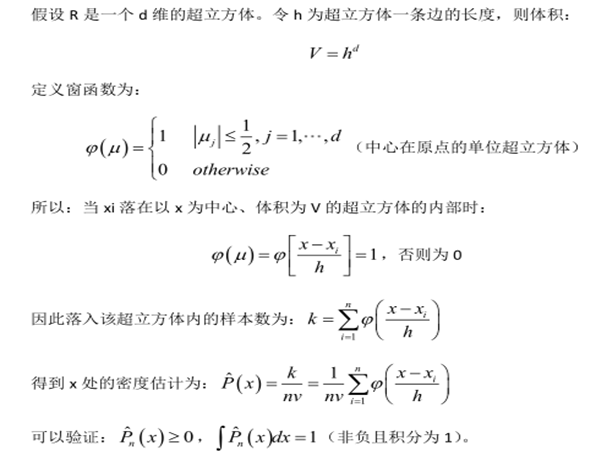
已知样本所属类别,但未知概率密度函数的形式,要求不用模型,而只利用训练数据本身对概率密度做估计。如:parzen窗函数办法,k近邻估计等。
思路:x->p(xlwi),直接用样本来估计概率密度函数,能处理任意的概率分布,而不必假设概率密度函数的形式已知。
parzen窗的原理如下:
第三问,参考这篇文章。
4.程序实现
第一问:两种方法,基于sklearn与不基于sklearn,如下:


# -*- coding: utf-8 -*-

#Import Library of Gaussian Naive Bayes model
from sklearn.metrics import accuracy_score
from sklearn.naive_bayes import GaussianNB


def getData(filename):
    fr1=open(filename)

    arrayOLines1=fr1.readlines() #读取文件

    #特征矩阵
    X=[]
    y=[]
    #男同学
    for line in arrayOLines1:
        line=line.strip() #strip()去掉首尾空格
        listFromLine=line.split() #按空白字符分割成列表

        #将m,f变成1,0
        for i in range(len(listFromLine)):
            if listFromLine[2] == 'm':
               listFromLine[2] = 1
            elif listFromLine[2] == 'f':
                listFromLine[2] = 0
            else:
                listFromLine[2]=listFromLine[2]
        #string变float
        for i in range(len(listFromLine)):
            listFromLine[i]=float(listFromLine[i])

        #X是指特征向量;y是标签
        X.append([listFromLine[0],listFromLine[1]])
        y.append(listFromLine[2])

    return X,y

#训练数据
features_train,labels_train = getData('dataset1.txt')
#print(features_train,labels_train)
#创建一个高斯型分布的分类器
#model = GaussianNB(priors=[0.2,0.8])
model = GaussianNB()

# Train the model using the training sets
model.fit(features_train, labels_train)

# 用训练好的分类器去预测测试集的标签值
features_test,labels_test = getData('dataset2.txt')
pred =model.predict(features_test)

# 计算并返回在测试集上的准确率
y_pred =pred
y_true =labels_test
accuracy_score(y_true, y_pred)

print(accuracy_score(y_true, y_pred,normalize=False))
# -*- coding: utf-8 -*-

#-*-encoding:utf-8-*-
import numpy
import math

def importdata(filename = 'dataset1.txt') :
    '''
    导入训练集
    '''
    f = open(filename,'r')
    dataset = []
    #arr = []
    for item in f :
        vars = item.split()
        dataset.append([float(vars[0]), float(vars[1]), vars[2].upper()])
    return dataset

def getParameters(dataset) :
    '''
    从训练集分别获取不同类别下的期望、方差、标准差、类别的先验概率以及变量间相关系数
    '''
    class1 = []
    class2 = []
    class_sum = []
    for item in dataset :
        class_sum.append([item[0],item[1]])
        if item[-1] == 'F' :
            class1.append([item[0],item[1]])
        if item[-1] == 'M' :
            class2.append([item[0],item[1]])
    class1 = numpy.array(class1)
    class2 = numpy.array(class2)
    class_total = numpy.array(class_sum)
    mean1 = numpy.mean(class1,axis=0)
    variance1 = numpy.var(class1,axis=0)
    stand_deviation1 = numpy.std(class1,axis=0)
    mean2 = numpy.mean(class2,axis=0)
    variance2 = numpy.var(class2,axis=0)
    stand_deviation2 = numpy.std(class2,axis=0)
    class_total = (len(class1) + len(class2)) * 1.0

    mean = numpy.mean(class_sum, axis=0)
    stand_deviation = numpy.std(class_sum, axis=0)

    new_arr = [ ((item[0] - mean[0]) * (item[1] - mean[1]) / stand_deviation[0] / stand_deviation[1])  for item in dataset]
    coefficient = numpy.mean(new_arr)

    return (mean1,mean2),(variance1,variance2),(stand_deviation1, stand_deviation2),(len(class1)/class_total,len(class2)/class_total),coefficient


def GaussianFunc(mean, variance, stand_deviation, coefficient) :
    '''
    根据指定参数(期望、方差、标准差、多元向量间的相关性)生成高斯函数
    多元变量的高斯函数
    '''
    def func(X) :
        X = [X[0] - mean[0], X[1] - mean[1]]
        B = [[variance[0], coefficient * stand_deviation[0] * stand_deviation[1]],[coefficient * stand_deviation[0] * stand_deviation[1], variance[1]]]
        inv_B = numpy.linalg.inv(B)
        A = inv_B
        B_val = (1.0 - coefficient**2) * variance[0] * variance[1]
        tmp1 = 2*math.pi * (B_val ** 0.5)
        X = numpy.array([X])
        tmp2 = (-0.5) * numpy.dot(numpy.dot(X, A), X.T)
        res = 1.0 / tmp1 * (math.e ** tmp2)
        return res
    return func


def f(X, funcs, class_ps, index) :
    '''
    贝叶斯概率计算函数
    '''
    tmp1 = funcs[index](X) * class_ps[index]
    tmp2 = funcs[0](X) * class_ps[0] + funcs[1](X) * class_ps[1]
    return tmp1 / tmp2


def classify(X,funcs,class_ps,labels) :
    '''
    基于最小错误率的贝叶斯判别分类。对于二类分类问题,简化了。
    '''
    res1 = f(X,funcs,class_ps,0)
    res2 = f(X,funcs,class_ps,1)
    if res1 > res2 :
        return labels[0]
    else :
        return labels[1]

def test(dataset, funcs,class_ps,labels) :
    '''
    测试
    '''
    positive0 = 0
    positive1 = 0
    F = [item for item in dataset if item[-1] == 'F']
    len_F = len(F)
    len_M = len(dataset) - len_F
    for item in dataset :
        res = classify([item[0],item[1]], funcs, class_ps,labels)
        if res == item[-1] and res == 'F' :
            positive0 += 1
        if res == item[-1] and res == 'M' :
            positive1 += 1
    print ('F', positive0 * 1.0 / len_F)
    print ('M', positive1 * 1.0 / len_M)


if __name__ == '__main__' :
    dataset = importdata()
    (mean1,mean2),(variance1,variance2),(stand_deviation1, stand_deviation2), (class1_p, class2_p), coefficient = getParameters(dataset)
    func1 = GaussianFunc(mean1, variance1, stand_deviation1,coefficient)
    func2 = GaussianFunc(mean2, variance2, stand_deviation2,coefficient)
    #print func1([160,45])
    #print func1([170,50])
    #print func1([175,50])
    #print func1([190,20])
    funcs = []
    funcs.append(func1)
    funcs.append(func2)
    class_ps = []
    class_ps.append(class1_p)
    class_ps.append(class2_p)

    classs = [class_ps]
    '''
    手工指定先验概率
    '''
    classs.append([0.5,0.5])
    classs.append([0.4,0.6])
    classs.append([0.3,0.7])
    classs.append([0.2,0.8])

    labels = ['F', 'M']
    for class_ps in classs :
        print( '-' * 24)
        print (class_ps)

        print ('-'*10,'dataset1','-'*10)
        testset0 = importdata('dataset1.txt')
        test(testset0, funcs, class_ps, labels)

        print ('-'*10,'dataset2','-'*10)
        testset1 = importdata('dataset2.txt')
        test(testset1, funcs, class_ps, labels)

        print ('-'*10,'dataset3','-'*10)
        testset2 = importdata('dataset3.txt')
        test(testset2, funcs, class_ps, labels)
第二问:
# -*- coding: utf-8 -*-

import numpy as np


# 读取数据
def getData(filename):
    fr1=open(filename)

    arrayOLines1=fr1.readlines() #读取文件

    #特征矩阵
    X=[]
    #y=[]
    #男同学
    for line in arrayOLines1:
        line=line.strip() #strip()去掉首尾空格
        listFromLine=line.split() #按空白字符分割成列表

        #将m,f变成1,0
        for i in range(len(listFromLine)):
            if listFromLine[2] == 'm':
               listFromLine[2] = 1
            elif listFromLine[2] == 'f':
                listFromLine[2] = 0
            else:
                listFromLine[2]=listFromLine[2]
        #string变float
        for i in range(len(listFromLine)):
            listFromLine[i]=float(listFromLine[i])

        #X是指特征向量;y是标签
        #X.append([listFromLine[0],listFromLine[1]])
        #y.append(listFromLine[2])
        X.append(listFromLine)
    return X


def get_phi(x, xi, h):
    x = np.mat(x)
    xi = np.mat(xi)
    phi = np.exp(-(x - xi) * (x - xi).T / (2 * h * h))
    return phi


def get_px(x, xi, h):
    phi = 0
    n = len(xi)
    for i in range(n):
        # print("xi[i]", xi[i])
        phi += get_phi(x, xi[i], h)
    px = phi * 3 / (4 * np.pi * n * np.power(h, 3))
    return px


def parzen(h, test, data):
    positive0 = 0
    positive1 = 0

    px = [0, 0]
    print("h =", h)

    for j in range(len(test)):
        #print("x =", test[j])
        for i in range(len(px)):
            xi = [x[:3] for x in filter(lambda x: x[2] == i , data)]

            # print("xi", xi)
            # print("len xi", len(xi))
            px[i] = get_px(test[j], xi, h)
           # print("px", i, "=", px[i])

        if px[0] > px[1] :
            pedict0 = 0
            if pedict0  == test[j][2]:
                positive0 += 1
            #print("belong to w1")

        if px[0] < px[1]:
            #print("belong to w2")
            pedict1 = 1
            if pedict1  == test[j][2]:
                positive1 += 1

    print ('F', positive0 * 1.0 / 40 )
    print ('M', positive1 * 1.0 / 84)

def main():
    data = getData('dataset1.txt')
    # print(np.mat(data))
    test = getData('dataset2.txt')
    h1 = 1
    h2 = 0.1

    parzen(h1, test, data)
    parzen(h2, test, data)


if __name__ == '__main__':
    main()
第三问:
# -*- coding: utf-8 -*-

import matplotlib.pyplot as plt
import numpy as np


def importdata(filename) :
    '''
    导入训练集
    '''
    f = open(filename,'r')
    dataset = []
    #arr = []
    for item in f :
        vars = item.split()
        dataset.append([float(vars[0]), float(vars[1]), vars[2].upper()])
    return dataset

def getparameters(dataset) :
    '''
    从训练集分别获取不同类别下的期望、方差、标准差、类别的先验概率以及变量间相关系数
    '''
    class1 = []
    class2 = []
    class_sum = []
    for item in dataset :
        class_sum.append([item[0],item[1]])
        if item[-1] == 'F' :
            class1.append([item[0],item[1]])
        if item[-1] == 'M' :
            class2.append([item[0],item[1]])
    class1 = np.array(class1)
    class2 = np.array(class2)
    class_total = np.array(class_sum)
    return class1,class2,class_total

#fisher算法实现
#为下一个函数fisher中的一个语句做定义
def cal_cov_and_avg(samples):
    """
    给定一个类别的数据,计算协方差矩阵和平均向量
    :param samples:
    :return:
    """
    u1 = np.mean(samples, axis=0)
    cov_m = np.zeros((samples.shape[1], samples.shape[1]))
    for s in samples:
        t = s - u1
        cov_m += t * t.reshape(2, 1)
    return cov_m, u1

def fisher(c_1, c_2):
    """
    fisher算法实现(请参考上面推导出来的公式,那个才是精华部分)
    :param c_1:
    :param c_2:
    :return:
    """
    cov_1, u1 = cal_cov_and_avg(c_1)#调用上一个函数
    cov_2, u2 = cal_cov_and_avg(c_2)#调用上一个函数
    s_w = cov_1 + cov_2
    u, s, v = np.linalg.svd(s_w)  # 奇异值分解
    s_w_inv = np.dot(np.dot(v.T, np.linalg.inv(np.diag(s))), u.T)
    return np.dot(s_w_inv, u1 - u2)

def judge(sample, w, c_1, c_2):
    """
    true 属于1
    false 属于2
    :param sample:
    :param w:
    :param center_1:
    :param center_2:
    :return:
    """
    u1 = np.mean(c_1, axis=0)
    u2 = np.mean(c_2, axis=0)
    center_1 = np.dot(w.T, u1)
    center_2 = np.dot(w.T, u2)
    pos = np.dot(w.T, sample)
    return abs(pos - center_1) < abs(pos - center_2)


if __name__ == '__main__' :
    dataset = importdata('dataset1.txt')
    c_1,c_2,c_total = getparameters(dataset)
    #print('c_1',c_1)
    #print('c_2',c_2)
    (h1,w) =np.shape(c_1)
    #print(h1)
    (h2,w) =np.shape(c_2)
    #print(h2)


    w = fisher(c_1, c_2)# 调用函数,得到参数w

    for i in range(0,h1):
        out1 = judge(c_1[i], w, c_1, c_2)   # 判断所属的类别
        #print(out1)
    for i in range(0,h2):
        out2 = judge(c_2[i], w, c_1, c_2)   # 判断所属的类别
        #print(out2)


    plt.title("scatter diagram")
    plt.scatter(c_1[:, 0], c_1[:, 1], color="red")
    plt.scatter(c_2[:, 0], c_2[:, 1], color="black")
    line_x = np.arange(min(np.min(c_1[:, 0]), np.min(c_2[:, 0])),
                   max(np.max(c_1[:, 0]), np.max(c_2[:, 0])),
                   step=1)

    line_y = -(w[1] * line_x) / w[0]
    plt.plot(line_x, line_y)
    plt.xlim(xmax=200,xmin=150)
    plt.ylim(ymax=200,ymin=-100)
    plt.xlabel("x")
    plt.ylabel("y")