对图像进行滤波,可以有两种效果:
- 一种是平滑滤波,用来抑制噪声;
- 一种是微分算子,可以用来检测边缘和特征提取。
skimage库中通过filters模块进行滤波操作。
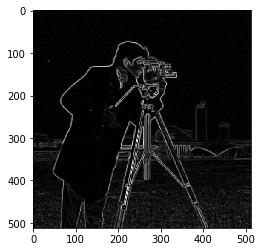
一 sobel算子
sobel算子可用来检测边缘。函数格式为:skimage.filters.sobel(image, mask=None)
from skimage import data,filters
import matplotlib.pyplot as plt
img = data.camera()
edges = filters.sobel(img)
plt.imshow(edges,plt.cm.gray)
结果如下图所示:
二 roberts算子
功能同sobel,调用格式:
edges = filters.roberts(img)
三 scharr算子
功能同sobel,调用格式:
edges = filters.scharr(img)
四 prewitt算子
功能同sobel,调用格式:
edges = filters.prewitt(img)
五 canny算子
canny算子也是用于提取边缘特征,但它不是放在filters模块,而是放在feature模块
函数格式:skimage.feature.canny(image,sigma=1.0)
可以修改sigma的值来调整效果。
from skimage import data,feature
import matplotlib.pyplot as plt
img = data.camera()
edges1 = feature.canny(img)   #sigma=1
edges2 = feature.canny(img,sigma=3)   #sigma=3

plt.figure('canny',figsize=(8,8))
plt.subplot(121)
plt.imshow(edges1,plt.cm.gray)

plt.subplot(122)
plt.imshow(edges2,plt.cm.gray)

plt.show()
结果如下图所示:
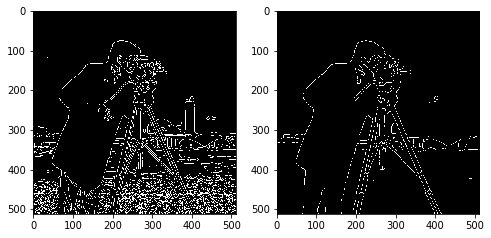
从结果可以看出,sigma越小,边缘线条越细小。
六 gabor滤波
gabor滤波可用来进行边缘检测和纹理特征提取。
函数调用格式:skimage.filters.gabor_filter(image, frequency)
通过修改frequency值来调整滤波效果,返回一对边缘结果,一个是用真实滤波核的滤波结果,一个是想象的滤波核的滤波结果。
from skimage import data,filters
import matplotlib.pyplot as plt
img = data.camera()
filt_real, filt_imag = filters.gabor_filter(img,frequency=0.6)

plt.figure('gabor',figsize=(8,8))

plt.subplot(121)
plt.title('filt_real')
plt.imshow(filt_real,plt.cm.gray)

plt.subplot(122)
plt.title('filt-imag')
plt.imshow(filt_imag,plt.cm.gray)

plt.show()
结果如下图所示:

七 gaussian滤波
多维的滤波器,是一种平滑滤波,可以消除高斯噪声。
调用函数为:skimage.filters.gaussian_filter(image, sigma)
通过调节sigma的值来调整滤波效果。
from skimage import data,filters
import matplotlib.pyplot as plt
img = data.camera()
edges1 = filters.gaussian_filter(img,sigma=0.4)   #sigma=0.4
edges2 = filters.gaussian_filter(img,sigma=5)   #sigma=5

plt.figure('gaussian',figsize=(8,8))
plt.subplot(121)
plt.imshow(edges1,plt.cm.gray)

plt.subplot(122)
plt.imshow(edges2,plt.cm.gray)

plt.show()
结果为:
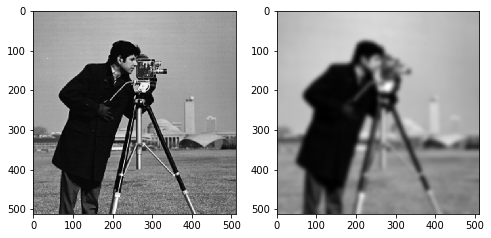
注:
- sigma越大,过滤后的图像越模糊。
- 可以对RGB格式的图像进行降噪处理,前六种只能对灰度图提取边缘特征。
八 median滤波
中值滤波,一种平滑滤波,可以消除噪声。用skimage.morphology模块来设置滤波器的形状。
from skimage import data,filters
import matplotlib.pyplot as plt
from skimage.morphology import disk
img = data.camera()
edges1 = filters.median(img,disk(5))
edges2= filters.median(img,disk(9))

plt.figure('median',figsize=(8,8))

plt.subplot(121)
plt.imshow(edges1,plt.cm.gray)

plt.subplot(122)
plt.imshow(edges2,plt.cm.gray)

plt.show()
注:
- 滤波器越大,图像越模糊。
- 只能对灰度图进行降噪处理。
九 水平、垂直边缘检测
上边所举的例子都是进行全部边缘检测,有些时候我们只需要检测水平边缘,或垂直边缘,就可用下面的方法。
- 水平边缘检测:sobel_h, prewitt_h, scharr_h
- 垂直边缘检测: sobel_v, prewitt_v, scharr_v
from skimage import data,filters
import matplotlib.pyplot as plt
img = data.camera()
edges1 = filters.sobel_h(img)
edges2 = filters.sobel_v(img)

plt.figure('sobel_v_h',figsize=(8,8))

plt.subplot(121)
plt.title("水平边缘检测")
plt.imshow(edges1,plt.cm.gray)

plt.subplot(122)
plt.title("垂直边缘检测")
plt.imshow(edges2,plt.cm.gray)
plt.show()
结果如下所示:

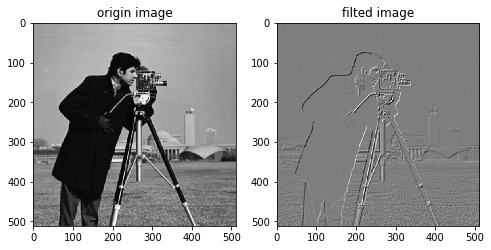
十 交叉边缘检测
可使用Roberts的十字交叉核来进行过滤,以达到检测交叉边缘的目的。这些交叉边缘实际上是梯度在某个方向上的一个分量。
其中一个核:
 0   1
-1   0
对应的函数:
roberts_neg_diag(image)
from skimage import data,filters
import matplotlib.pyplot as plt
img =data.camera()
dst =filters.roberts_neg_diag(img)

plt.figure('filters',figsize=(8,8))
plt.subplot(121)
plt.title('origin image')
plt.imshow(img,plt.cm.gray)

plt.subplot(122)
plt.title('filted image')
plt.imshow(dst,plt.cm.gray)
结果为:

另外一个核:
1   0
0  -1
对应函数为:
roberts_pos_diag(image)
from skimage import data,filters
import matplotlib.pyplot as plt
img =data.camera()
dst =filters.roberts_pos_diag(img)

plt.figure('filters',figsize=(8,8))
plt.subplot(121)
plt.title('origin image')
plt.imshow(img,plt.cm.gray)

plt.subplot(122)
plt.title('filted image')
plt.imshow(dst,plt.cm.gray)
结果如下所示: