相信很多SQL Server DBA或开发人员在重建或重组大表索引时,都会相当郁闷,不知道索引重建的进度,这个对于DBA完全是一个黑盒子,对于系统负载非常大的系统或维护窗口较短的系统,你会遇到一些挑战。例如,你创建索引的时候,很多会话被阻塞,你只能取消创建索引的任务。查看这些索引维护操作的进度、预估时间对于我们有较大的意义,需要根据这个做一些决策。下面我们来看看看看如何获取CREATE INDEX、ALTER INDEX REBUILD、ALTER INDEX ORGANIZE的进度。
索引重组
从SQL Server 2008开始,有个DMV视图sys.dm_exec_requests,里面有个字段percent_complete表示以下命令完成的工作的百分比,这里面就包括索引重组(ALTER INDEX REORGANIZE),这其中不包括ALTER INDEX REBUILD,可以查看索引重组(ALTER INDEX ORGANIZE)完成的百分比。也就是说在SQL Server 2008之前是无法获取索引重组的进度情况的。
|
percent_complete |
real |
Percentage of work completed for the following commands: |
测试环境:SQL Server 2008 、 2017 RTM CU13
SELECT  er.session_id ,
        er.blocking_session_id ,
        er.status ,
        er.command ,
        DB_NAME(er.database_id) DB_name ,
        er.wait_type ,
        et.text SQLText ,
        er.percent_complete
FROM    sys.dm_exec_requests er
        CROSS APPLY sys.dm_exec_sql_text(er.sql_handle) et
WHERE   er.session_id = 57
        AND er.session_id <> @@SPID;

索引重建
上面DMV视图sys.dm_exec_requests是否也可以查看索引重建的进度呢? 答案是不行,测试发现percent_complete这个进度一直为0,那么要如何查看索引重建(INDEX REBUILD)的进度呢?
不过自SQL Server 2014开始,SQL Server提供了一个新特性:sys.dm_exec_query_profiles,它可以实时监控正在执行的查询的进度情况(Monitors real time query progress while the query is in execution)。当然,需要启用实时查询监控才行。一般只需启用会话级别的实时查询监控,可以通过启用SET STATISTICS XML ON; 或SET STATISTICS PROFILE ON;开启。而从SQL Server 2016 (13.x)SP1 开始,您可以或者开启跟踪标志 7412或使用 query_thread_profile 扩展的事件。下面是官方文档的描述:
In SQL Server 2014 (12.x) SP2 and later use SET STATISTICS PROFILE ON or SET STATISTICS XML ON together with the query under investigation. This enables the profiling infrastructure and produces results in the DMV for the session where the SET command was executed. If you are investigating a query running from an application and cannot enable SET options with it, you can create an Extended Event using the query_post_execution_showplan event which will turn on the profiling infrastructure.
In SQL Server 2016 (13.x) SP1, you can either turn on trace flag 7412 or use the query_thread_profile extended event.
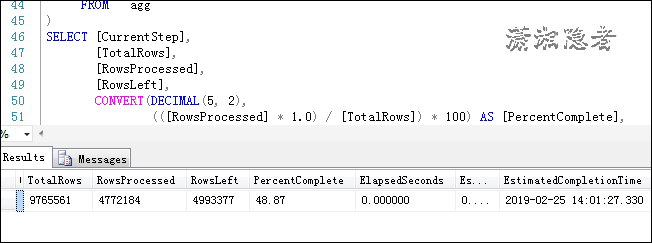
--Configure query for profiling with sys.dm_exec_query_profiles

SET STATISTICS PROFILE ON;

GO


--Or enable query profiling globally under SQL Server 2016 SP1 or above

DBCC TRACEON (7412, -1);

GO


ALTER INDEX Your_Index_Name ON Your_Table_Name REBUILD;

GO


DECLARE @SPID INT = 53;

;WITH agg AS
(
     SELECT SUM(qp.[row_count]) AS [RowsProcessed],
            SUM(qp.[estimate_row_count]) AS [TotalRows],
            MAX(qp.last_active_time) - MIN(qp.first_active_time) AS [ElapsedMS],
            MAX(IIF(qp.[close_time] = 0 AND qp.[first_row_time] > 0,
                    [physical_operator_name],
                    N'<Transition>')) AS [CurrentStep]
     FROM sys.dm_exec_query_profiles qp
     WHERE qp.[physical_operator_name] IN (N'Table Scan', N'Clustered Index Scan', N'Sort' , N'Index Scan')
     AND   qp.[session_id] = @SPID
), comp AS
(
     SELECT *,
            ([TotalRows] - [RowsProcessed]) AS [RowsLeft],
            ([ElapsedMS] / 1000.0) AS [ElapsedSeconds]
     FROM   agg
)
SELECT [CurrentStep],
       [TotalRows],
       [RowsProcessed],
       [RowsLeft],
       CONVERT(DECIMAL(5, 2),
               (([RowsProcessed] * 1.0) / [TotalRows]) * 100) AS [PercentComplete],
       [ElapsedSeconds],
       (([ElapsedSeconds] / [RowsProcessed]) * [RowsLeft]) AS [EstimatedSecondsLeft],
       DATEADD(SECOND,
               (([ElapsedSeconds] / [RowsProcessed]) * [RowsLeft]),
               GETDATE()) AS [EstimatedCompletionTime]
FROM   comp;
注意事项:在SQL Server 2016 SP1之前,如果要使用sys.dm_exec_query_profiles查看索引重建的进度,那么就必须在索引重建之前设置SET STATISTICS PROFILE ON or SET STATISTICS XML ON。 而自
SQL Server 2016 SP1之后,可以使用DBCC TRACEON (7412, -1);开启全局会话的跟踪标记,或者开启某个会话的跟踪标记,当然如果要使用sys.dm_exec_query_profiles查看索引重建的进度,也必须开启7412跟踪标记
,然后重建索引,否则也没有值。
注意事项::索引重组时,sys.dm_exec_query_profiles中没有数据。所以sys.dm_exec_query_profiles不能用来查看索引重组的进度。
新建索引
新建索引进度的查询,也可以使用下面SQL语句。这里不做展开。
DECLARE @SPID INT = 56;

;WITH agg AS
(
     SELECT SUM(qp.[row_count]) AS [RowsProcessed],
            SUM(qp.[estimate_row_count]) AS [TotalRows],
            MAX(qp.last_active_time) - MIN(qp.first_active_time) AS [ElapsedMS],
            MAX(IIF(qp.[close_time] = 0 AND qp.[first_row_time] > 0,
                    [physical_operator_name],
                    N'<Transition>')) AS [CurrentStep]
     FROM sys.dm_exec_query_profiles qp
     WHERE qp.[physical_operator_name] IN (N'Table Scan', N'Clustered Index Scan', N'Sort' , N'Index Scan')
     AND
       qp.[session_id] = @SPID
), comp AS
(
     SELECT *,
            ([TotalRows] - [RowsProcessed]) AS [RowsLeft],
            ([ElapsedMS] / 1000.0) AS [ElapsedSeconds]
     FROM   agg
)
SELECT [CurrentStep],
       [TotalRows],
       [RowsProcessed],
       [RowsLeft],
       CONVERT(DECIMAL(5, 2),
               (([RowsProcessed] * 1.0) / [TotalRows]) * 100) AS [PercentComplete],
       [ElapsedSeconds],
       (([ElapsedSeconds] / [RowsProcessed]) * [RowsLeft]) AS [EstimatedSecondsLeft],
       DATEADD(SECOND,
               (([ElapsedSeconds] / [RowsProcessed]) * [RowsLeft]),
               GETDATE()) AS [EstimatedCompletionTime]
FROM   comp;


SELECT
       node_id,
       physical_operator_name,
       SUM(row_count) row_count,
       SUM(estimate_row_count) AS estimate_row_count,
       CAST(SUM(row_count)*100 AS float)/SUM(estimate_row_count)  as estimate_percent_complete
FROM sys.dm_exec_query_profiles
WHERE session_id=@SPID
GROUP BY node_id,physical_operator_name
ORDER BY node_id desc;
参考资料:
https://docs.microsoft.com/zh-cn/sql/relational-databases/system-dynamic-management-views/sys-dm-exec-query-profiles-transact-sql?view=sql-server-2017
https://docs.microsoft.com/en-us/sql/relational-databases/system-dynamic-management-views/sys-dm-exec-requests-transact-sql?view=sql-server-2017
https://dba.stackexchange.com/questions/139191/sql-server-how-to-track-progress-of-create-index-command
https://support.microsoft.com/zh-cn/help/4053291/fix-sys-dm-exec-query-profiles-dmv-returns-wrong-estimate-row-count-in
https://blogs.msdn.microsoft.com/sql_pfe_blog/2016/12/22/create-index-monitoring-progress/