Delphi Prism已经安装了好几天,一直没有试一试。今天在学习用C#开发Silverlight,顺便也用Prism来了一次。
C#的代码:
using System;
using System.Collections.Generic;
using System.Linq;
using System.Net;
using System.Windows;
using System.Windows.Controls;
using System.Windows.Documents;
using System.Windows.Input;
using System.Windows.Media;
using System.Windows.Media.Animation;
using System.Windows.Shapes;
using Visifire.Charts;
using Visifire.Commons;
namespace Simple
{
public partial class Page : UserControl
{
public Page()
{
InitializeComponent();
// Create a new Visifire Chart
CreateChart();
}
/// <summary>
/// Function to create a chart
/// </summary>
public void CreateChart()
{
// Create a new instance of Chart
Chart chart = new Chart();
// Set the chart width and height
chart.Width = 500;
chart.Height = 300;
// Create a new instance of Title
Title title = new Title();
// Set title property
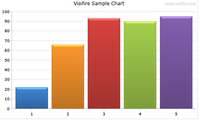
title.Text = "Visifire Sample Chart";
// Add title to Titles collection
chart.Titles.Add(title);
// Create a new instance of DataSeries
DataSeries dataSeries = new DataSeries();
// Set DataSeries property
dataSeries.RenderAs = RenderAs.Column;
// Create a DataPoint
DataPoint dataPoint;
for (int i = 0; i < 5; i++)
{
// Create a new instance of DataPoint
dataPoint = new DataPoint();
// Set YValue for a DataPoint
dataPoint.YValue = rand.Next(10, 100);
// Add dataPoint to DataPoints collection
dataSeries.DataPoints.Add(dataPoint);
}
// Add dataSeries to Series collection.
chart.Series.Add(dataSeries);
// Add chart to LayoutRoot
LayoutRoot.Children.Add(chart);
}
/// <summary>
/// Create a random class variable
/// </summary>
Random rand = new Random(DateTime.Now.Millisecond);
}
}
Delphi Prism的代码:
namespace SilverlightApplication1;
interface
uses
System,
System.Collections.Generic,
System.Linq,
System.Windows,
System.Windows.Controls,
System.Windows.Documents,
System.Windows.Ink,
System.Windows.Input,
System.Windows.Media,
System.Windows.Media.Animation,
System.Windows.Shapes,
Visifire.Charts,
Visifire.Commons;
type
Page = public partial class(System.Windows.Controls.UserControl)
private
rand :Random;
public
constructor;
method CreateChart();
end;
implementation
constructor Page;
begin
InitializeComponent();
// Create a new Visifire Chart
CreateChart();
end;
method Page.CreateChart();
Var
chart:Chart;
title:Title;
dataSeries:DataSeries;
dataPoint:DataPoint;
i:Integer;
begin
// Create a random class variable
rand:= new Random(DateTime.Now.Millisecond);
// Create a new instance of Chart
chart := new Chart();
// Set the chart width and height
chart.Width := 500;
chart.Height := 300;
// Create a new instance of Title
title := new Title();
// Set title property
title.Text := "Visifire Sample Chart";
// Add title to Titles collection
chart.Titles.Add(title);
// Create a new instance of DataSeries
dataSeries := new DataSeries();
// Set DataSeries property
dataSeries.RenderAs := RenderAs.Column;
// Create a DataPoint
//DataPoint dataPoint;
for i := 0 to 4 do
begin
// Create a new instance of DataPoint
dataPoint := new DataPoint();
// Set YValue for a DataPoint
dataPoint.YValue := rand.Next(10, 100);
// Add dataPoint to DataPoints collection
dataSeries.DataPoints.Add(dataPoint);
end;
// Add dataSeries to Series collection.
chart.Series.Add(dataSeries);
// Add chart to LayoutRoot
LayoutRoot.Children.Add(chart);
End;
end.