分析文件’课程成绩.xlsx’,至少要完成内容:
1)每年不同班级平均成绩情况
2)不同年份总体平均成绩情况
3)不同性别学生成绩情况,并分别用合适的图表展示出三个内容的分析结果。
导入相应的库
from functools import reduce
import xlrd
from flask import Flask, jsonify, render_template, request, url_for
from pyecharts import Line,Bar,Pie,Radar
python读取excel文件数据
excel_path="..\class.xlsx"
    #打开文件,获取excel文件的workbook(工作簿)对象
    excel=xlrd.open_workbook(excel_path,encoding_override="utf-8")
    # 返回所有Sheet对象的list
    all_sheet=excel.sheets()
    #循环遍历每个sheet对象存储表中所有数据
    grade_list=[]
    # 将文件中数据存进grade_list
    for sheet in all_sheet:
        for each_row in range(sheet.nrows):#循环打印每一行
            # each_row="".join(str(each_row).split())
            grade_list.append(sheet.row_values(each_row))
python图表中文乱码
#设置中文乱码
from pylab import *
mpl.rcParams['font.sans-serif'] = ['SimHei']
列表数据相加求平均
    def sum_list(items):
        sum_numbers = 0
        count = 0
        for x in items:
            sum_numbers += x
            count += 1
        return int(sum_numbers / count)
查找不同年级的班级所有数据
#查找不同年级的班级所有数据
    def deffentScore(grade):
        #不同年级对应的数据
        grade_score=[]
        for grade_list_row in grade_list:
            if grade in grade_list_row[0]:
                grade_score.append(grade_list_row)
        return grade_score
    #查找不同年级的班级
    def deffentGrade(grade):
        #不同年级对应的分类
        grade_score=[]
        for grade_list_row in grade_list:
            if grade in grade_list_row[0] and grade_list_row[0] not in grade_score:
                grade_score.append(grade_list_row[0])
        return grade_score
图利用map和reduce编写一个str2float函数,把字符串转化成浮点数
利用map和reduce编写一个str2float函数,把字符串‘123.456’转换成浮点数123.456
def StrToFloat(s):
    l=s.split('.')
    return reduce(lambda x,y:int(x)+int(y)/10**len(y),l)
python移除列表空数据
#移除空数据,缺考数据,移除表格中的空格
    def removeNull(alist):
        for i in alist:
            if '缺考' in i[4] or '' in i:
                alist.remove(i)
        clist=[]
        for i in alist:
            blist=[]
            count=0
            for y in i:
                y=''.join(str(y).split())
                count+=1
                if count>2 and count<6:
                    if '.'in y:
                        y=StrToFloat(y)
                    else:
                        y=int(y)
                blist.append(y)
            clist.append(blist)
        return clist
flask框架使用,并从前端页面获取数据,后台处理返回页面
from flask import Flask, jsonify, render_template, request, url_for
app = Flask(__name__)
def main():
@app.route("/index")
def index():
    overAll()
    overAllTwo()
    return render_template("Base.html")
@app.route('/test1',methods=['POST'])
def testGet1():
    sex = request.form.get('sex')
    sex1(str(sex))
    print("执行get1")
    return render_template("Base.html")
if __name__ == '__main__':
    main()
    app.run(host='127.0.0.1', port=8080, debug=True)
<!DOCTYPE html>
<html lang="en">
<head>
    <meta charset="UTF-8">
    <title>课程分析</title>
</head>
<body>
    <div style="display: flex; flex-direction: column">
        <div>
            <form action="/test" method="post">
                <input type="text" name="year" >
                <input type="submit" value="提交" onclick="change(1)">
            </form>
            <br>
            <iframe src="http://127.0.0.1:8080/yearClass"
                    width="850px" height="400px"   frameborder="1/0"
                    name="" id="iframe-a" scrolling="no"></iframe>
        </div>
        <div>
            <iframe src="http://127.0.0.1:8080/overall"
                    width="850px" height="400px"   frameborder="1/0"
                    name="" id="iframe-b" scrolling="no"></iframe>
        </div>
        <div>
            <iframe src="http://127.0.0.1:8080/overalltwo"
                    width="850px" height="400px"   frameborder="1/0"
                    name="" id="iframe-c" scrolling="no"></iframe>
        </div>
        <div>
            <form action="/test1" method="post">
                <input type="text" name="sex" >
                <input type="submit" value="提交" onclick="change(2)">
            </form>
            <br>
            <iframe src="http://127.0.0.1:8080/sex"
                    width="850px" height="400px"   frameborder="1/0"
                    name="" id="iframe-d" scrolling="no"></iframe>
        </div>
    </div>
</body>
<script>

    function change(e) {
        if(e==1){
            document.getElementById('iframe-a').contentWindow.location.reload();
        }
        else if(e==2){
            document.getElementById('iframe-d').contentWindow.location.reload();
        }
    }
</script>
</html>
1、项目采用的技术栈
flask框架
Numpy:矩阵计算与其它大多数框架的数据处理基础;
Matplotlab:专业画图工具,话说这个单词还是真是在Matlab之间插入了plot这个词形成的;
PyEcharts:是一款将python与echarts结合的强大的数据可视化工具,可以展示动态图,在线报告使用比较美观,并且展示数据方便,鼠标悬停在图上,即可显示数值、标签等。
2、系统模块列表
柱状图、饼图、折线图、雷达图
3、柱状图:每年不同班级平均成绩情况
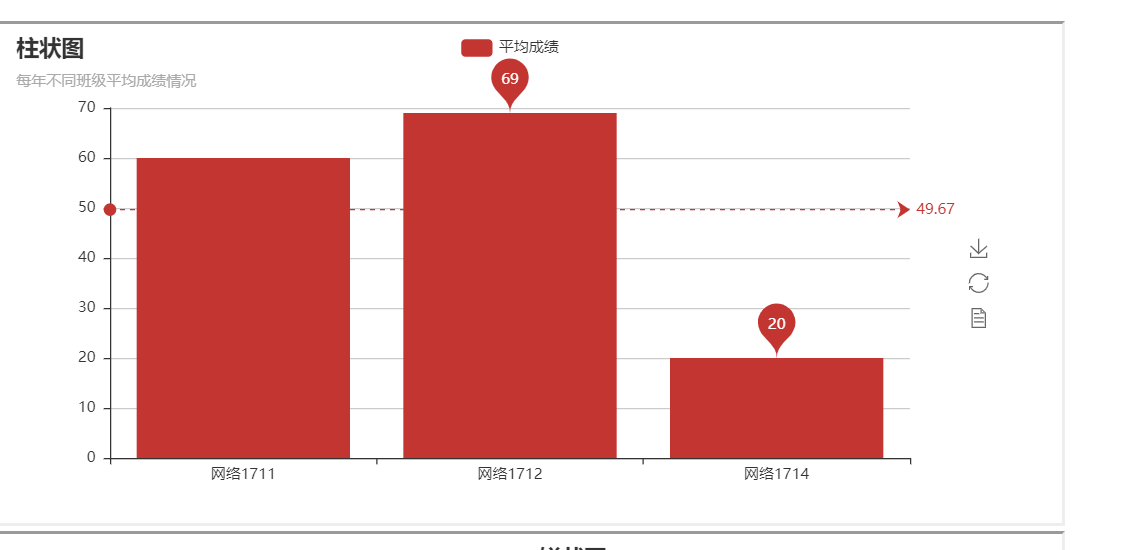
@app.route('/test',methods=['POST'])
    def testGet():
        year = request.form.get('year')
        year_score=deffentScore(year)
        year_class=deffentGrade(year)
        avg_score=differentClassesEachYear(year_class,year_score)
        #绘图
        # //设置柱状图的主标题与副标题
        bar = Bar("柱状图", "每年不同班级平均成绩情况")
        # //添加柱状图的数据及配置项
        bar.add("平均成绩", year_class, avg_score, mark_line=["average"], mark_point=["max", "min"])
        # //生成本地文件(默认为.html文件)
        bar.render('./templates/yearClass.html')
        print("执行get")
        return render_template("Base.html")
4、饼图:根据不同年份总体分析平均成绩情况
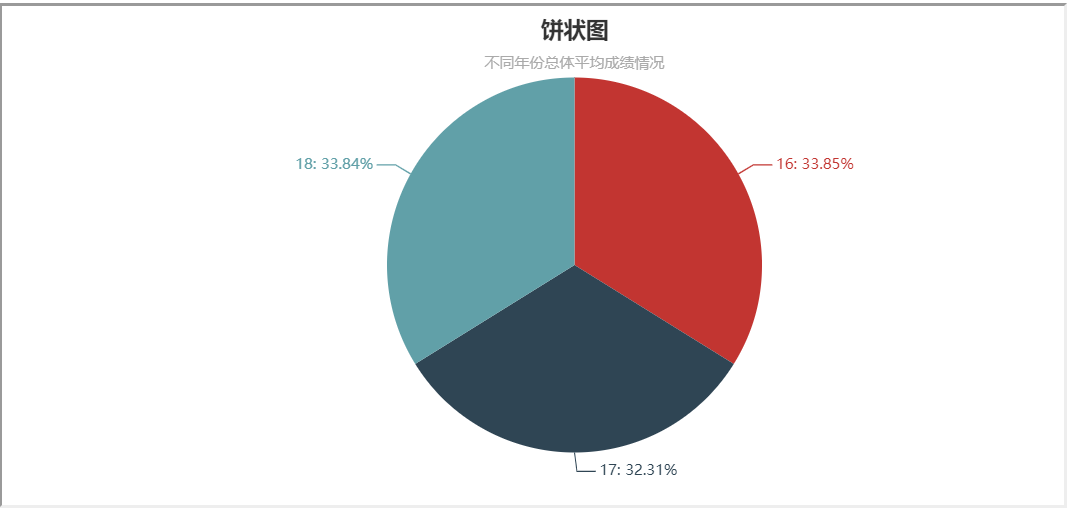
def overAll():
        year=['2016','2017','2018']
        year=['16','17','18']
        year_score=[]
        for i in year:
            list1=[]
            for grade_list_row in grade_list:
                if i in grade_list_row[0]:
                    list1.append(grade_list_row[4])
            year_score.append(sum_list(list1))
        # //设置主标题与副标题,标题设置居中,设置宽度为900
        pie = Pie("饼状图", "不同年份总体平均成绩情况",title_pos='center',width=900)
        # //加入数据,设置坐标位置为【75,50】,上方的colums选项取消显示,显示label标签
        pie.add("年份", year, year_score ,center=[50,50],is_legend_show=False,is_label_show=True)
        # //保存图表
        pie.render('./templates/overall.html')
5、折线图
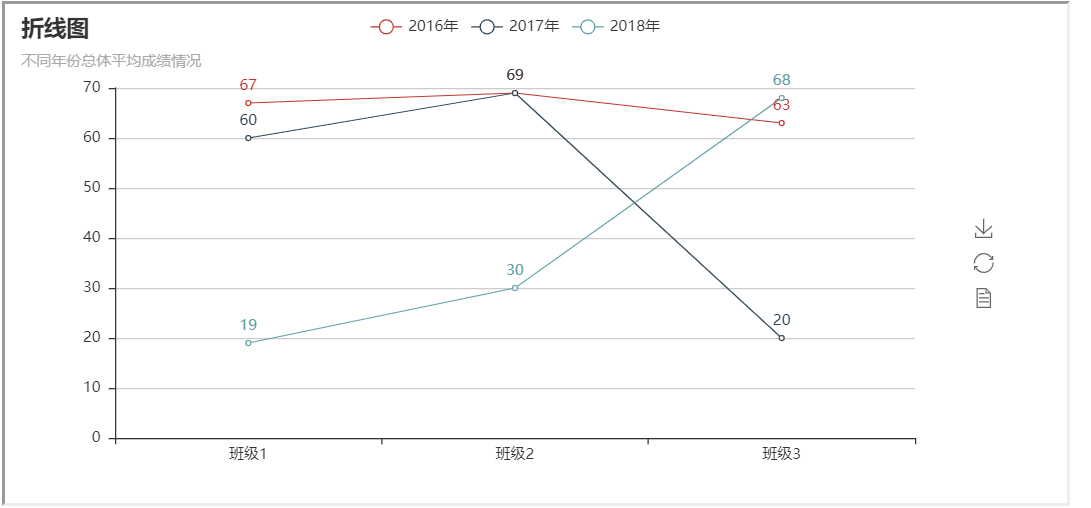
def overAllTwo():
        year_score=deffentScore('16')
        year_class=deffentGrade('16')
        avg_score=differentClassesEachYear(year_class,year_score)
        year_score1=deffentScore('17')
        year_class1=deffentGrade('17')
        avg_score1=differentClassesEachYear(year_class1,year_score1)
        year_score2=deffentScore('18')
        year_class2=deffentGrade('18')
        avg_score2=differentClassesEachYear(year_class2,year_score2)
        class1=['班级1','班级2','班级3']
        #移除最后一个元素
        avg_score2.pop()
        line = Line("折线图","不同年份总体平均成绩情况")
        # //is_label_show是设置上方数据是否显示
        line.add("2016年", class1, avg_score, is_label_show=True)
        line.add("2017年", class1, avg_score1, is_label_show=True)
        line.add("2018年", class1, avg_score2, is_label_show=True)
        line.render('./templates/overalltwo.html')
6、雷达图:根据不同性别学生分析成绩情况
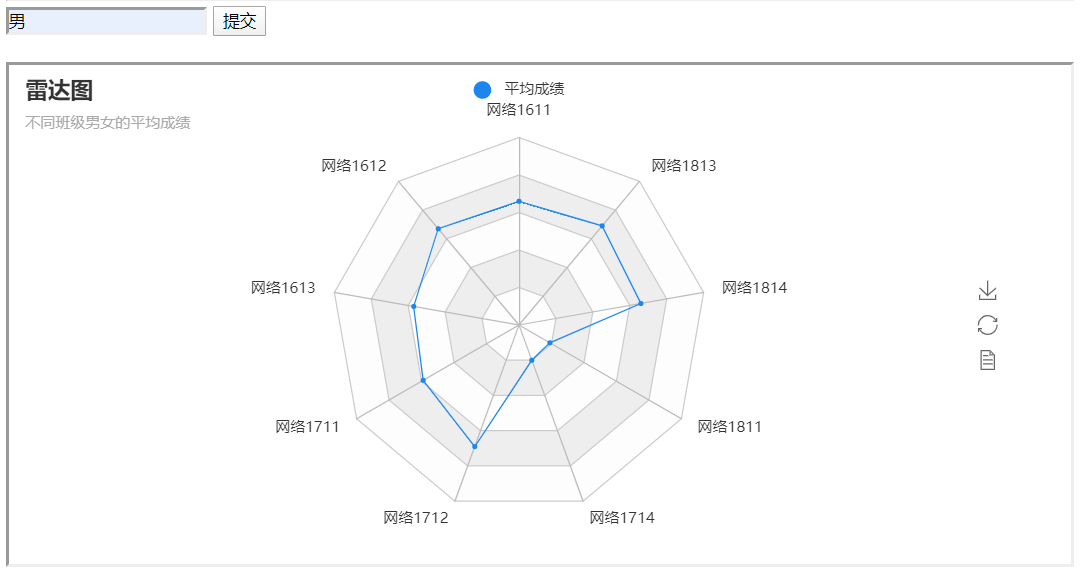
def sex1(sexName):
        sex_score=[]
        sex_class=[]
        score=[]
        for grade_list_row in grade_list:
            if sexName in grade_list_row[1]:
                sex_score.append(grade_list_row)
        for grade_list_row in sex_score:
            if grade_list_row[0] not in sex_class:
                sex_class.append(grade_list_row[0])
        for className in sex_class:
            list1=[]
            for grade_list_row in sex_score:
                if className==grade_list_row[0]:
                    list1.append(grade_list_row[4])
            score.append(sum_list(list1))
        score1=[]
        score1.append(score)
        print(score1,sex_class)
        radar = Radar("雷达图", "不同班级男女的平均成绩")
        schema =[('网络1611',100), ('网络1612',100), ('网络1613',100),
                 ('网络1711',100), ('网络1712',100), ('网络1714',100),
                 ( '网络1811',100), ('网络1814',100), ('网络1813',100)]
        # //传入坐标
        radar.config(schema)
        # //一般默认为同一种颜色,这里为了便于区分,需要设置item的颜色
        radar.add("平均成绩",score1,item_color="#1C86EE")
        radar.render('./templates/sex.html')