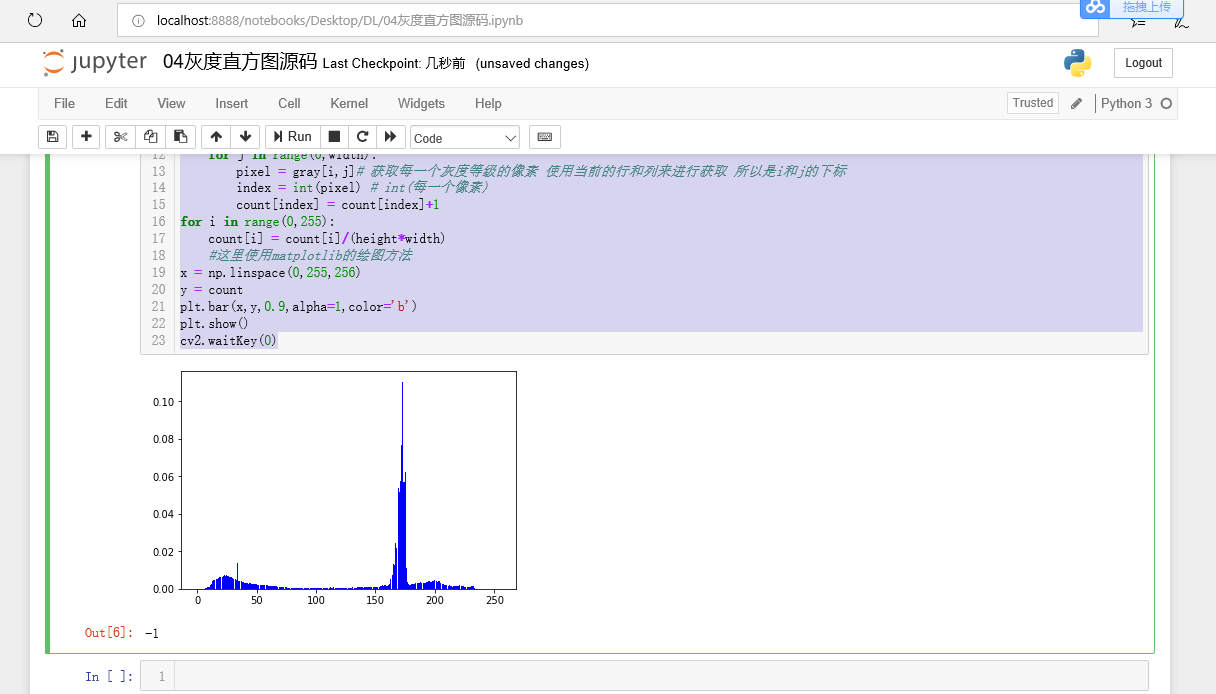
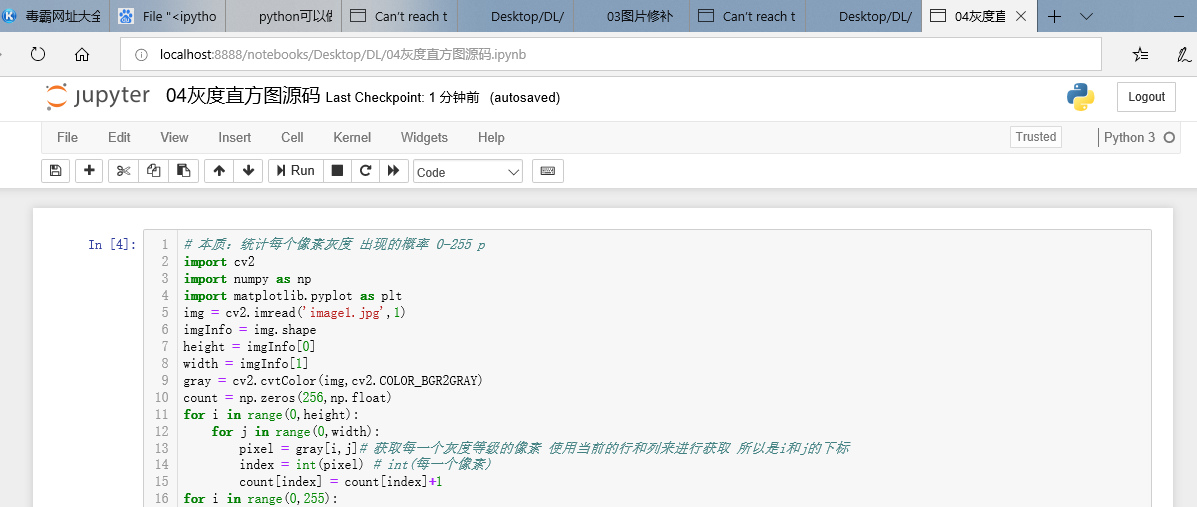
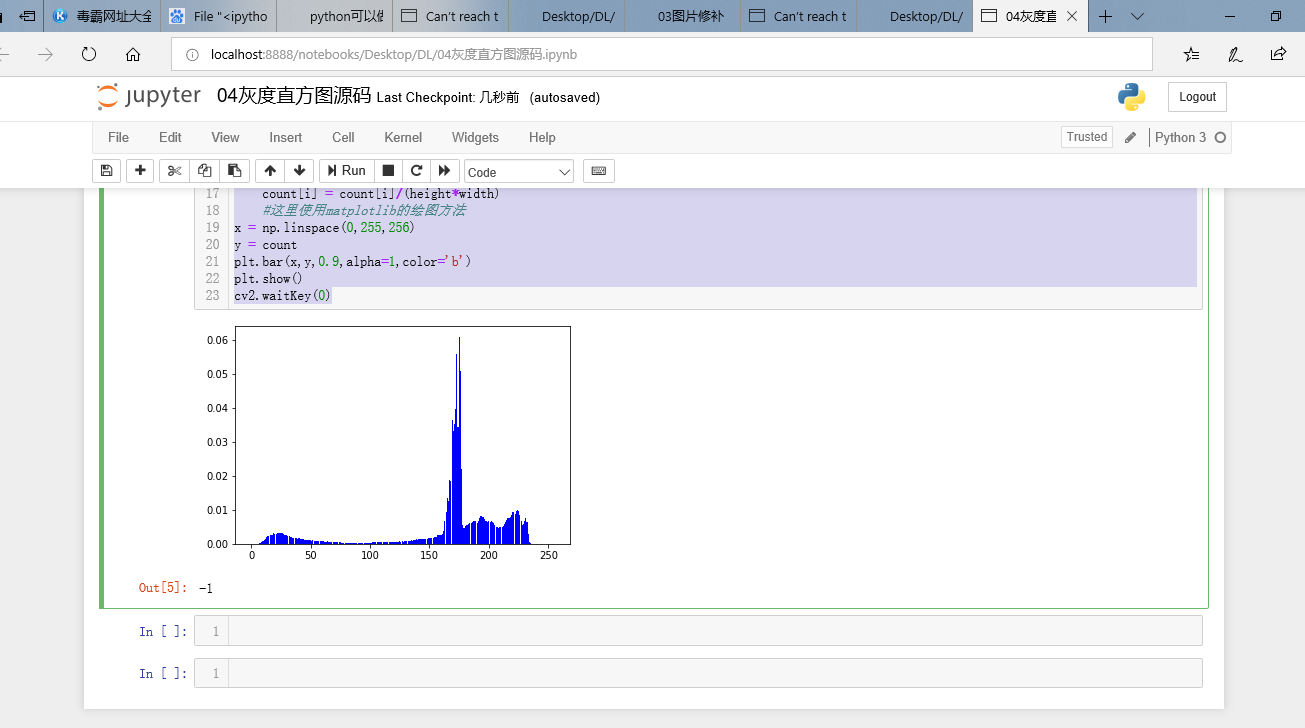
直方图是为了统计图像中每个像素灰度出现的概率,这是它的中心思想,也是它的基本原则。
所以它的横坐标是0-255,总共256种灰度等级。而纵坐标是出现的概率p。这是它的基本思想。
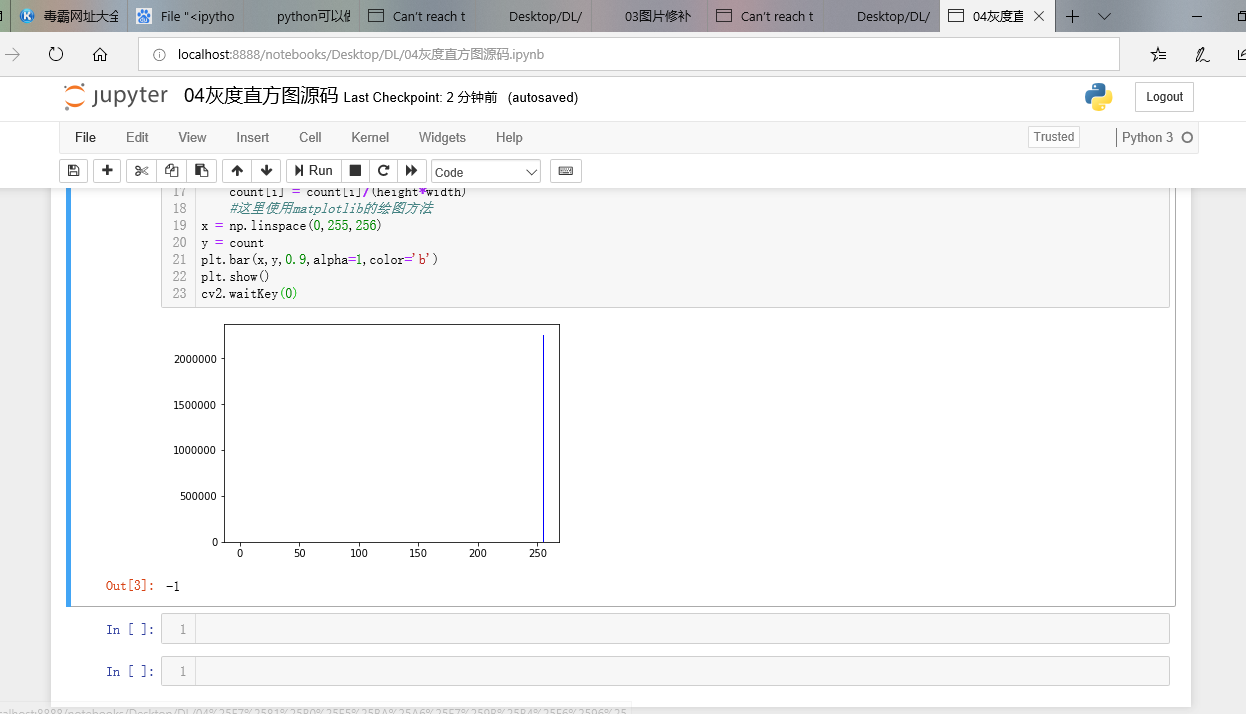
这个count中记录的就是我们当前灰度图像每一个像素值在每一个灰度等级下出现的概率。它总共有256个灰度等级。因为它计算出来的灰度等级概率的话有可能是一个浮点类型。
使用for的形式循环遍历图片中的每一个数据。
每一个灰度等级出现的概率,这个概率的分子是count里面的内容。分母是我们所有的像素总的个数。
可以使用opencv或者matplotlib的绘图方法。
还要算一下每一个bar它所在的整个的百分比。
# 本质:统计每个像素灰度 出现的概率 0-255 p
import cv2
import numpy as np
import matplotlib.pyplot as plt
img = cv2.imread('image0.jpg',1)
imgInfo = img.shape
height = imgInfo[0]
width = imgInfo[1]
gray = cv2.cvtColor(img,cv2.COLOR_BGR2GRAY)
count = np.zeros(256,np.float)
for i in range(0,height):
    for j in range(0,width):
        pixel = gray[i,j]# 获取每一个灰度等级的像素 使用当前的行和列来进行获取 所以是i和j的下标
        index = int(pixel) # int(每一个像素)
        count[index] = count[index]+1
for i in range(0,255):
    count[i] = count[i]/(height*width)
    #这里使用matplotlib的绘图方法
x = np.linspace(0,255,256)
y = count
plt.bar(x,y,0.9,alpha=1,color='b')
plt.show()
cv2.waitKey(0)
# 本质:统计每个像素灰度 出现的概率 0-255 p
import cv2
import numpy as np
import matplotlib.pyplot as plt
img = cv2.imread('image2.jpg',1)
imgInfo = img.shape
height = imgInfo[0]
width = imgInfo[1]
gray = cv2.cvtColor(img,cv2.COLOR_BGR2GRAY)
count = np.zeros(256,np.float)
for i in range(0,height):
    for j in range(0,width):
        pixel = gray[i,j]# 获取每一个灰度等级的像素 使用当前的行和列来进行获取 所以是i和j的下标
        index = int(pixel) # int(每一个像素)
        count[index] = count[index]+1
for i in range(0,255):
    count[i] = count[i]/(height*width)
    #这里使用matplotlib的绘图方法
x = np.linspace(0,255,256)
y = count
plt.bar(x,y,0.9,alpha=1,color='b')
plt.show()
cv2.waitKey(0)
# 本质:统计每个像素灰度 出现的概率 0-255 p
import cv2
import numpy as np
import matplotlib.pyplot as plt
img = cv2.imread('image3.png',1)
imgInfo = img.shape
height = imgInfo[0]
width = imgInfo[1]
gray = cv2.cvtColor(img,cv2.COLOR_BGR2GRAY)
count = np.zeros(256,np.float)
for i in range(0,height):
    for j in range(0,width):
        pixel = gray[i,j]# 获取每一个灰度等级的像素 使用当前的行和列来进行获取 所以是i和j的下标
        index = int(pixel) # int(每一个像素)
        count[index] = count[index]+1
for i in range(0,255):
    count[i] = count[i]/(height*width)
    #这里使用matplotlib的绘图方法
x = np.linspace(0,255,256)
y = count
plt.bar(x,y,0.9,alpha=1,color='b')
plt.show()
cv2.waitKey(0)