如果我们想要对一个网页进行性能监控,那么使用window.performance是一个比较好的选择。
我们通过window.performance可以获取到用户访问一个页面的每个阶段的精确时间,从而对性能进行分析。
一、页面性能监控
1、利用performance.timing来监控网页的性能
网页的整个生命周期

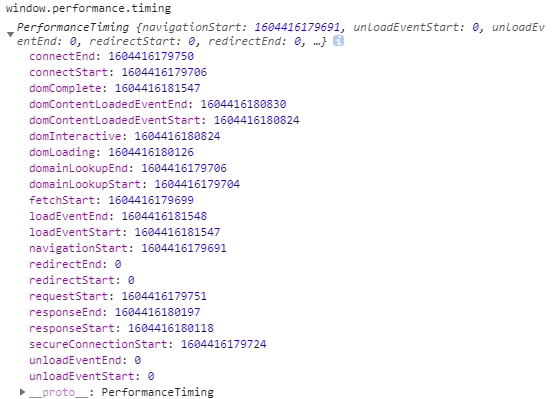
PerformanceTiming属性如下
PerformanceTiming.navigationStart
表示从同一个浏览器上下文的上一个文档卸载(unload)结束时的UNIX时间戳。如果没有上一个文档,这个值会和PerformanceTiming.fetchStart相同。

PerformanceTiming.unloadEventStart
表示unload事件抛出时的UNIX时间戳。如果没有上一个文档,或者,如果上一个文档或所需的重定向之一不是来自同一个源, 这个值会返回0.

PerformanceTiming.unloadEventEnd
表示unload事件处理完成时的UNIX时间戳。如果没有上一个文档,或者,如果上一个文档或所需的重定向之一不是来自同一个源, 这个值会返回0.

PerformanceTiming.redirectStart
表示第一个HTTP重定向开始时的UNIX时间戳。如果没有重定向,或者重定向中的一个不同源,这个值会返回0.

PerformanceTiming.redirectEnd
表示最后一个HTTP重定向完成时(也就是说是HTTP响应的最后一个比特直接被收到的时间)的UNIX时间戳。如果没有重定向,或者重定向中的一个不同源,这个值会返回0.

PerformanceTiming.fetchStart
表示浏览器准备好使用HTTP请求来获取(fetch)文档的UNIX时间戳。这个时间点会在检查任何应用缓存之前。

PerformanceTiming.domainLookupStart
表示域名查询开始的UNIX时间戳。如果使用了持续连接(persistent connection),或者这个信息存储到了缓存或者本地资源上,这个值将和 PerformanceTiming.fetchStart一致。

PerformanceTiming.domainLookupEnd
表示域名查询结束的UNIX时间戳。如果使用了持续连接(persistent connection),或者这个信息存储到了缓存或者本地资源上,这个值将和 PerformanceTiming.fetchStart一致。

PerformanceTiming.connectStart
返回HTTP请求开始向服务器发送时的Unix毫秒时间戳。如果使用持久连接(persistent connection),则返回值等同于fetchStart属性的值。

PerformanceTiming.connectEnd
返回浏览器与服务器之间的连接建立时的Unix毫秒时间戳。如果建立的是持久连接,则返回值等同于fetchStart属性的值。连接建立指的是所有握手和认证过程全部结束。

PerformanceTiming.secureConnectionStart
返回浏览器与服务器开始安全链接的握手时的Unix毫秒时间戳。如果当前网页不要求安全连接,则返回0。

PerformanceTiming.requestStart
返回浏览器向服务器发出HTTP请求时(或开始读取本地缓存时)的Unix毫秒时间戳。

PerformanceTiming.responseStart
返回浏览器从服务器收到(或从本地缓存读取)第一个字节时的Unix毫秒时间戳。如果传输层在开始请求之后失败并且连接被重开,该属性将会被数制成新的请求的相对应的发起时间。

PerformanceTiming.responseEnd
返回浏览器从服务器收到(或从本地缓存读取,或从本地资源读取)最后一个字节时(如果在此之前HTTP连接已经关闭,则返回关闭时)的Unix毫秒时间戳。

PerformanceTiming.domLoading
返回当前网页DOM结构开始解析时(即Document.readyState属性变为“loading”、相应的 readystatechange事件触发时)的Unix毫秒时间戳。

PerformanceTiming.domInteractive
返回当前网页DOM结构结束解析、开始加载内嵌资源时(即Document.readyState属性变为“interactive”、相应的readystatechange事件触发时)的Unix毫秒时间戳。

PerformanceTiming.domContentLoadedEventStart
返回当解析器发送DOMContentLoaded 事件,即所有需要被执行的脚本已经被解析时的Unix毫秒时间戳。

PerformanceTiming.domContentLoadedEventEnd
返回当所有需要立即执行的脚本已经被执行(不论执行顺序)时的Unix毫秒时间戳。

PerformanceTiming.domComplete
返回当前文档解析完成,即Document.readyState 变为 'complete'且相对应的readystatechange 被触发时的Unix毫秒时间戳。

PerformanceTiming.loadEventStart
返回该文档下,load事件被发送时的Unix毫秒时间戳。如果这个事件还未被发送,它的值将会是0。

PerformanceTiming.loadEventEnd
返回当load事件结束,即加载事件完成时的Unix毫秒时间戳。如果这个事件还未被发送,或者尚未完成,它的值将会是0
如何获取PerformanceTiming
我们可以直接使用JS语法即可获取到
<script>
    var mytiming = window.performance.timing;
    console.log(mytiming)
</script>
利用timing分析网页
DNS查询耗时 :domainLookupEnd - domainLookupStart
TCP链接耗时 :connectEnd - connectStart
SSL安全连接耗时: connectEnd - secureConnectionStart
request请求耗时 :responseEnd - responseStart
解析dom树耗时 : domComplete - domInteractive
首次渲染时间/白屏时间 :responseStart - navigationStart
domready时间:domContentLoadedEventEnd - navigationStart
onload时间(总下载时间) :loadEventEnd - navigationStart
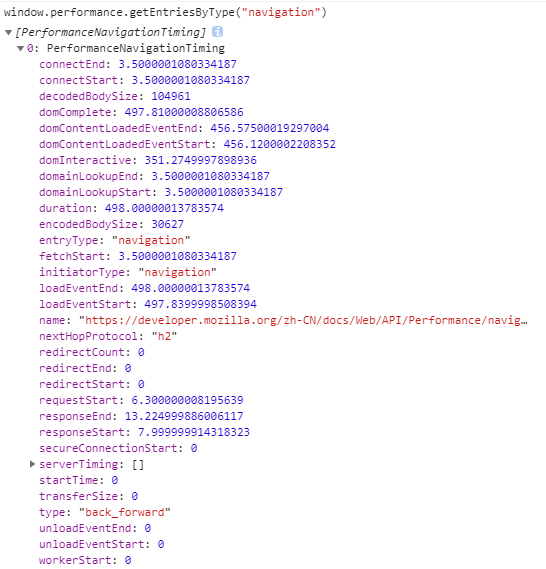
2、利用window.performance.getEntriesByType("navigation")来监控网页的性能
window.performance.getEntriesByType("navigation")和performance.timing实际上是大同小异的,
只是说这个window.performance.getEntriesByType("navigation")的时间更精确
如何获取window.performance.getEntriesByType("navigation")
我们可以直接使用JS语法即可获取到
<script>
    var mytiming = window.performance.getEntriesByType("navigation")[0];
    console.log(mytiming)
</script>
利用timing分析网页
DNS查询耗时 :domainLookupEnd - domainLookupStart
TCP链接耗时 :connectEnd - connectStart
SSL安全连接耗时: connectEnd - secureConnectionStart
request请求耗时 :responseEnd - responseStart
解析dom树耗时 : domComplete - domInteractive
首次渲染时间/白屏时间 :responseStart - startTime
domready时间 :domContentLoadedEventEnd - startTime
onload时间(总下载时间) :duration
二、页面资源监控
1、页面资源时间介绍
资源加载时间是指:网页打开的过程中,各个图片、JS、CSS文件加载的时间。
资源加载的各个阶段的时间戳,如重定向、DNS查询、TCP连接建立。这些阶段和他们的属性名在图中列出。
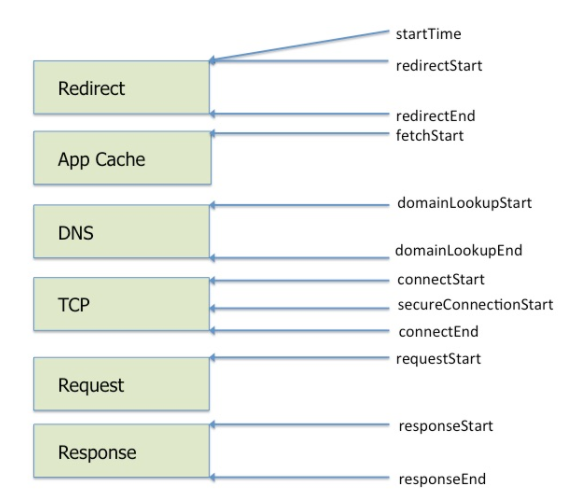
或者这么看也行
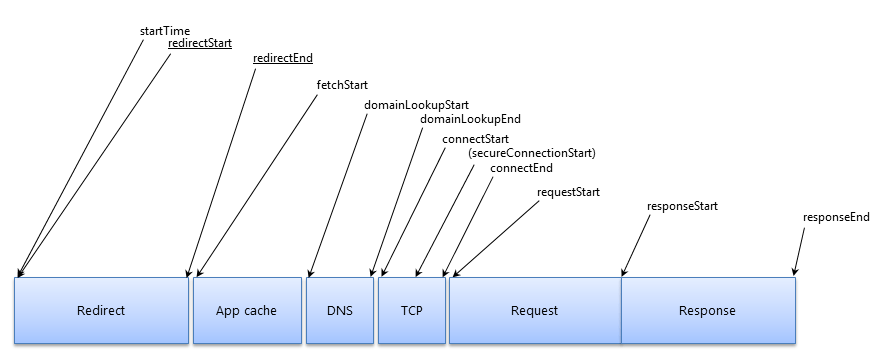
应用开发者可以使用这些属性值去计算某个阶段的耗时长度,用来帮助诊断性能问题。
我们还可以使用Chrome浏览器的开发者模式查看:
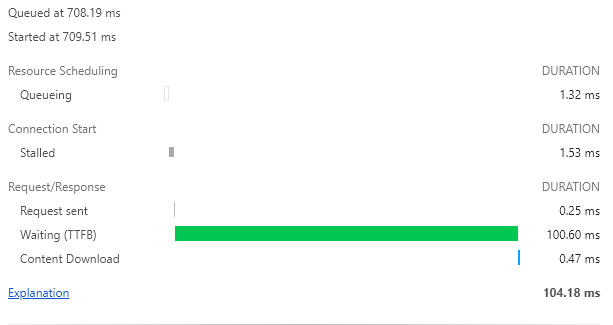
Queueing: 请求被阻塞,放入等待队列中等待。
一般以下几个原因会被阻塞:
- 如果这个资源加载优先级比较低,比如图片(html/css/js的优先级比图片高),那么图片请求就会被渲染引擎阻塞,等待优先级高的资源加载完成才从队列中取出,等待发送。
- 我们知道浏览器对同一域名下对TCP连接的并发数有限制(防止资源被消耗殆尽),chrome这边是6,那么如果同一域名下请求多于6的话,后面的请求就会被阻塞。
- 等待释放TCP连接
Stalled: 等待发送所用的时间,原因同上。
DNS Lookup:DNS查询时间
Initail connection:建立TCP连接所用的时间
SSL:建立SSL连接所用的时间
Request sent:发出请求的时间,通常不到一毫秒
TTFB:第一字节时间,即请求发出到接受到服务器第一个字节的时间,如果这个时间太长,一般有两个原因:
- 网络太差
- 服务器响应太慢
一般建议不要这个阶段的时间不要超过200毫秒。
Content Download:资源下载时间,如果被阻塞,则这个时间会很长,或者资源过大也会导致下载时间过长。例如js执行时间过长,那么图片加载下来的时间就会被拉到很长。
2、Resource Timing API
var resources = window.performance.getEntriesByType('resource');
console.log(resources);
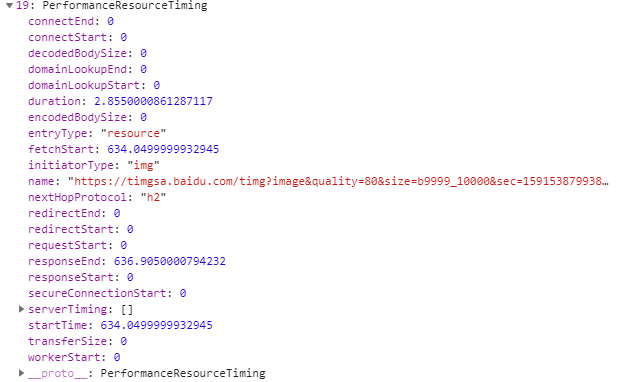
startTime
在资源提取开始的时间。该值等于fetchStart。

duration
资源完成下载的总时间,它是responseEnd和startTime属性之间的差异。

redirectStart
重定向的开始时间。

redirectEnd
紧接在收到最后一次重定向响应的最后一个字节后。

fetchStart
如果是应用缓存在实现请求,将采集 fetchStart 时间。

domainLookupStart
DNS请求开始时间

domainLookupEnd
DNS请求结束时间

connectStart
开始建立与服务器的连接时间(TCP握手时间)。

connectEnd
在浏览器完成与服务器的连接以检索资源之后(TCP握手结束时间)。

secureConnectionStart
在浏览器启动握手过程之前,以保护当前连接(如果正在使用 TLS 或 SSL 将在握手(确保连接安全)开始时开始)。

requestStart
浏览器开始从服务器请求资源之前(在对某个资源的请求被发送到服务器后立即采集。)。

responseStart
在浏览器收到服务器响应的第一个字节后(服务器初始响应请求的时间)。

responseEnd
在浏览器收到资源的最后一个字节之后或紧接在传输连接关闭之前,以先到者为准(请求结束并且数据完成检索的时间)。

transferSize
表示获取资源的大小(以八位字节为单位)的数字。 包括响应头字段和响应payload body的大小。

encodedBodySize
在删除任何应用的内容编码之前,从payload body的提取(HTTP或高速缓存)接收的大小(以八位字节为单位)的数字。

decodedBodySize
在删除任何应用的内容编码之后,从消息正文( message body )的提取(HTTP或缓存)接收的大小(以八位字节为单位)的数字。

serverTiming
包含服务器时序度量( timing metrics )的PerformanceServerTiming 条目数组。
那么,我们可以根据这些时间属性,对某些资源进行解析:
整个过程时间: responseEnd - startTime 或者 duration
查看DNS查询时间: domainLookupEnd - domainLookupStart
查看TCP三次握手时间(HTTP): connectEnd - connectStart
SSL握手时间(HTTPS协议会有SSL握手):connectEnd - secureConnectionStart
TTFB(首包时间):responseStart - startTime
响应时间(剩余包时间): responseEnd - responseStart
附上官方例子
各阶段资源时间
function calculate_load_times() {
  // Check performance support
  if (performance === undefined) {
    console.log("= Calculate Load Times: performance NOT supported");
    return;
  }

  // Get a list of "resource" performance entries
  var resources = performance.getEntriesByType("resource");
  if (resources === undefined || resources.length <= 0) {
    console.log("= Calculate Load Times: there are NO `resource` performance records");
    return;
  }

  console.log("= Calculate Load Times");
  for (var i=0; i < resources.length; i++) {
    console.log("== Resource[" + i + "] - " + resources[i].name);
    // Redirect time
    var t = resources[i].redirectEnd - resources[i].redirectStart;
    console.log("... Redirect time = " + t);

    // DNS time
    t = resources[i].domainLookupEnd - resources[i].domainLookupStart;
    console.log("... DNS lookup time = " + t);

    // TCP handshake time
    t = resources[i].connectEnd - resources[i].connectStart;
    console.log("... TCP time = " + t);

    // Secure connection time
    t = (resources[i].secureConnectionStart > 0) ? (resources[i].connectEnd - resources[i].secureConnectionStart) : "0";
    console.log("... Secure connection time = " + t);

    // Response time
    t = resources[i].responseEnd - resources[i].responseStart;
    console.log("... Response time = " + t);

    // Fetch until response end
    t = (resources[i].fetchStart > 0) ? (resources[i].responseEnd - resources[i].fetchStart) : "0";
    console.log("... Fetch until response end time = " + t);

    // Request start until reponse end
    t = (resources[i].requestStart > 0) ? (resources[i].responseEnd - resources[i].requestStart) : "0";
    console.log("... Request start until response end time = " + t);

    // Start until reponse end
    t = (resources[i].startTime > 0) ? (resources[i].responseEnd - resources[i].startTime) : "0";
    console.log("... Start until response end time = " + t);
  }
}
资源大小
/*
应用程序资源的大小可能会影响应用程序的性能,因此获取有关资源大小的准确数据非常重要(尤其是对于非托管资源)。该PerformanceResourceTiming接口具有三个属性,可用于获取有关资源的大小数据。该transferSize属性返回获取的资源的大小(以八位字节为单位),包括响应头字段和响应有效载荷主体。该encodedBodySize属性返回从有效内容主体的提取(HTTP或缓存)接收的大小(以八位字节为单位),然后再删除任何应用的内容编码。decodedBodySize从抓取(HTTP或高速缓存)的接收到的返回的大小(以字节)消息主体,之后除去任何施加的内容编码。
*/
function display_size_data(){
  // Check for support of the PerformanceResourceTiming.*size properties and print their values
  // if supported.
  if (performance === undefined) {
    console.log("= Display Size Data: performance NOT supported");
    return;
  }

  var list = performance.getEntriesByType("resource");
  if (list === undefined) {
    console.log("= Display Size Data: performance.getEntriesByType() is  NOT supported");
    return;
  }

  // For each "resource", display its *Size property values
  console.log("= Display Size Data");
  for (var i=0; i < list.length; i++) {
    console.log("== Resource[" + i + "] - " + list[i].name);
    if ("decodedBodySize" in list[i])
      console.log("... decodedBodySize[" + i + "] = " + list[i].decodedBodySize);
    else
      console.log("... decodedBodySize[" + i + "] = NOT supported");

    if ("encodedBodySize" in list[i])
      console.log("... encodedBodySize[" + i + "] = " + list[i].encodedBodySize);
    else
      console.log("... encodedBodySize[" + i + "] = NOT supported");

    if ("transferSize" in list[i])
      console.log("... transferSize[" + i + "] = " + list[i].transferSize);
    else
      console.log("... transferSize[" + i + "] = NOT supported");
  }
}
在W3C Web性能工作组给我们带来的 导航计时 在2012年,它是现在市面上几乎所有的主流浏览器。导航计时定义了一个JavaScript API,用于测量主页的性能。例如:

//导航时间
var t = performance.timing,
    pageloadtime = t.loadEventStart-t.navigationStart,
    dns = t.domainLookupEnd-t.domainLookupStart,
    tcp = t.connectEnd-t.connectStart,
    ttfb = t.responseStart-t.navigationStart;
拥有主页的计时指标很棒,但是要诊断现实世界的性能问题,通常有必要深入研究各个资源。因此,我们拥有更新的 Resource Timing规范。该JavaScript API提供与导航计时类似的计时信息,但为每个单独的资源提供。一个例子是:

//资源计时
var r0 = performance.getEntriesByType("resource")[0]
    加载时间= r0.duration,
    dns = r0.domainLookupEnd-r0.domainLookupStart,
    tcp = r0.connectEnd-r0.connectStart,
    ttfb = r0.responseStart-r0.startTime;