本文档以Jupyter Notebook的形式编写,可以在此处查看或下载.
您可以使用DataFrame.style属性,根据其中的数据来应用条件格式 ,即DataFrame的外观样式. 这是一个返回Styler对象的属性,该对象具有用于格式化和显示DataFrame的有用方法.
样式是使用CSS完成的. 您可以编写"样式函数",这些函数使用标量, DataFrame或Series ,并返回带有类似索引的 DataFrames或Series以及带有CSS "attribute: value"对的值. 这些函数可以递增地传递给Styler ,后者在渲染之前收集样式.
Building styles
将样式函数传递给以下方法之一:
-
Styler.applymap:逐元素 -
Styler.apply:按列/按行/按表
这两个方法都采用一个函数(以及一些其他关键字参数),并以某种方式将函数应用于DataFrame. Styler.applymap通过DataFrame逐个Styler.applymap工作. Styler.apply将每一列或每一行或一次一次将整个表传递到DataFrame中,具体取决于axis关键字参数. 对于按列使用axis=0 ,按行使用axis=1 ,并且对于整个表一次使用axis=None .
对于Styler.applymap您的函数应采用标量,并返回带有CSS属性-值对的单个字符串.
对于Styler.apply您的函数应采用Series或DataFrame(取决于axis参数),并返回具有相同形状的Series或DataFrame,其中每个值都是带有CSS属性值对的字符串.
让我们看一些例子.
[2]:
import pandas as pd
import numpy as np

np.random.seed(24)
df = pd.DataFrame({'A': np.linspace(1, 10, 10)})
df = pd.concat([df, pd.DataFrame(np.random.randn(10, 4), columns=list('BCDE'))],
               axis=1)
df.iloc[3, 3] = np.nan
df.iloc[0, 2] = np.nan
这是一个呈现DataFrame的无聊示例,没有任何(可见)样式:
[3]:
df.style
[3]:
| A | B | C | D | E | |
|---|---|---|---|---|---|
| 0 | 1.000000 | 1.329212 | nan | -0.316280 | -0.990810 |
| 1 | 2.000000 | -1.070816 | -1.438713 | 0.564417 | 0.295722 |
| 2 | 3.000000 | -1.626404 | 0.219565 | 0.678805 | 1.889273 |
| 3 | 4.000000 | 0.961538 | 0.104011 | nan | 0.850229 |
| 4 | 5.000000 | 1.453425 | 1.057737 | 0.165562 | 0.515018 |
| 5 | 6.000000 | -1.336936 | 0.562861 | 1.392855 | -0.063328 |
| 6 | 7.000000 | 0.121668 | 1.207603 | -0.002040 | 1.627796 |
| 7 | 8.000000 | 0.354493 | 1.037528 | -0.385684 | 0.519818 |
| 8 | 9.000000 | 1.686583 | -1.325963 | 1.428984 | -2.089354 |
| 9 | 10.000000 | -0.129820 | 0.631523 | -0.586538 | 0.290720 |
注意 : DataFrame.style属性是一个返回Styler对象的属性. Styler具有_repr_html_因此它们被自动呈现在其上定义的方法. 如果您希望返回实际的HTML以进行进一步处理或写入文件,请调用.render()方法,该方法返回一个字符串.
上面的输出看起来与标准DataFrame HTML表示非常相似. 但是我们在幕后做了一些工作,将CSS类附加到每个单元格. 我们可以通过调用.render方法查看这些内容.
[4]:
df.style.highlight_null().render().split('
')[:10]
[4]:
['<style  type="text/css" >',
 '    #T_37521038_b0c3_11ea_808b_0242ac110002row0_col2 {',
 '            background-color:  red;',
 '        }    #T_37521038_b0c3_11ea_808b_0242ac110002row3_col3 {',
 '            background-color:  red;',
 '        }</style><table id="T_37521038_b0c3_11ea_808b_0242ac110002" ><thead>    <tr>        <th class="blank level0" ></th>        <th class="col_heading level0 col0" >A</th>        <th class="col_heading level0 col1" >B</th>        <th class="col_heading level0 col2" >C</th>        <th class="col_heading level0 col3" >D</th>        <th class="col_heading level0 col4" >E</th>    </tr></thead><tbody>',
 '                <tr>',
 '                        <th id="T_37521038_b0c3_11ea_808b_0242ac110002level0_row0" class="row_heading level0 row0" >0</th>',
 '                        <td id="T_37521038_b0c3_11ea_808b_0242ac110002row0_col0" class="data row0 col0" >1.000000</td>',
 '                        <td id="T_37521038_b0c3_11ea_808b_0242ac110002row0_col1" class="data row0 col1" >1.329212</td>']
row0_col2是该特定单元格的标识符. 我们还为每个行/列标识符添加了每个DataFrame唯一的UUID,以便一个样式不会与同一笔记本或页面中另一个样式的样式发生冲突(如果您愿意,可以设置uuid将两个DataFrame的样式结合在一起).
编写样式函数时,请注意生成所需的CSS属性/值对. 熊猫将它们与识别每个单元的CSS类进行匹配.
让我们编写一个简单的样式函数,该函数会将负数涂成红色,将正数涂成黑色.
[5]:
def color_negative_red(val):
    """
    Takes a scalar and returns a string with
    the css property `'color: red'` for negative
    strings, black otherwise.
    """
    color = 'red' if val < 0 else 'black'
    return 'color: %s' % color
在这种情况下,单元格的样式仅取决于其自身的值. 这意味着我们应该使用在Styler.applymap上起作用的Styler.applymap方法.
[6]:
s = df.style.applymap(color_negative_red)
s
[6]:
| A | B | C | D | E | |
|---|---|---|---|---|---|
| 0 | 1.000000 | 1.329212 | nan | -0.316280 | -0.990810 |
| 1 | 2.000000 | -1.070816 | -1.438713 | 0.564417 | 0.295722 |
| 2 | 3.000000 | -1.626404 | 0.219565 | 0.678805 | 1.889273 |
| 3 | 4.000000 | 0.961538 | 0.104011 | nan | 0.850229 |
| 4 | 5.000000 | 1.453425 | 1.057737 | 0.165562 | 0.515018 |
| 5 | 6.000000 | -1.336936 | 0.562861 | 1.392855 | -0.063328 |
| 6 | 7.000000 | 0.121668 | 1.207603 | -0.002040 | 1.627796 |
| 7 | 8.000000 | 0.354493 | 1.037528 | -0.385684 | 0.519818 |
| 8 | 9.000000 | 1.686583 | -1.325963 | 1.428984 | -2.089354 |
| 9 | 10.000000 | -0.129820 | 0.631523 | -0.586538 | 0.290720 |
请注意与标准df.applymap的相似之处,该标准df.applymap对元素的DataFrames进行操作. 我们希望您能够重用您现有的有关如何与DataFrames交互的知识.
Notice also that our function returned a string containing the CSS attribute and value, separated by a colon just like in a <style> tag. This will be a common theme.
最后,输入形状匹配. Styler.applymap在每个标量输入上调用该函数,并且该函数返回标量输出.
现在,假设您想突出显示每列中的最大值. 我们无法再使用.applymap ,因为该操作逐个元素进行. 相反,我们将转到.apply ,它按.apply (或使用axis关键字按行)操作. 稍后我们会看到类似highlight_max已经定义Styler ,所以你就不需要写自己.
[7]:
def highlight_max(s):
    '''
    highlight the maximum in a Series yellow.
    '''
    is_max = s == s.max()
    return [' color: rgb(0, 112, 32); font-weight: bold;">if v else '' for v in is_max]
[8]:
df.style.apply(highlight_max)
[8]:
| A | B | C | D | E | |
|---|---|---|---|---|---|
| 0 | 1.000000 | 1.329212 | nan | -0.316280 | -0.990810 |
| 1 | 2.000000 | -1.070816 | -1.438713 | 0.564417 | 0.295722 |
| 2 | 3.000000 | -1.626404 | 0.219565 | 0.678805 | 1.889273 |
| 3 | 4.000000 | 0.961538 | 0.104011 | nan | 0.850229 |
| 4 | 5.000000 | 1.453425 | 1.057737 | 0.165562 | 0.515018 |
| 5 | 6.000000 | -1.336936 | 0.562861 | 1.392855 | -0.063328 |
| 6 | 7.000000 | 0.121668 | 1.207603 | -0.002040 | 1.627796 |
| 7 | 8.000000 | 0.354493 | 1.037528 | -0.385684 | 0.519818 |
| 8 | 9.000000 | 1.686583 | -1.325963 | 1.428984 | -2.089354 |
| 9 | 10.000000 | -0.129820 | 0.631523 | -0.586538 | 0.290720 |
在这种情况下,输入为Series ,一次输入一列. 请注意, highlight_max的输出形状与输入形状匹配,这是一个包含len(s)项目的数组.
我们鼓励您使用方法链逐步构建样式,然后最终在链末尾进行渲染.
[9]:
df.style.
    applymap(color_negative_red).
    apply(highlight_max)
[9]:
| A | B | C | D | E | |
|---|---|---|---|---|---|
| 0 | 1.000000 | 1.329212 | nan | -0.316280 | -0.990810 |
| 1 | 2.000000 | -1.070816 | -1.438713 | 0.564417 | 0.295722 |
| 2 | 3.000000 | -1.626404 | 0.219565 | 0.678805 | 1.889273 |
| 3 | 4.000000 | 0.961538 | 0.104011 | nan | 0.850229 |
| 4 | 5.000000 | 1.453425 | 1.057737 | 0.165562 | 0.515018 |
| 5 | 6.000000 | -1.336936 | 0.562861 | 1.392855 | -0.063328 |
| 6 | 7.000000 | 0.121668 | 1.207603 | -0.002040 | 1.627796 |
| 7 | 8.000000 | 0.354493 | 1.037528 | -0.385684 | 0.519818 |
| 8 | 9.000000 | 1.686583 | -1.325963 | 1.428984 | -2.089354 |
| 9 | 10.000000 | -0.129820 | 0.631523 | -0.586538 | 0.290720 |
上面我们使用Styler.apply一次传递每一列.
调试提示:如果您在编写样式函数时遇到麻烦,请尝试将其传递到DataFrame.apply中. 在内部,Styler.apply使用DataFrame.apply,因此结果应该相同.
如果您只想突出显示整个表格中的最大值怎么办? 使用.apply(function, axis=None)表示您的函数需要整个表,而不是一次要一行或一行. 让我们接下来尝试.
我们将重写我们的.apply(axis=0 or 1) highlight-max以处理Series(来自.apply(axis=0 or 1) )或DataFrames(来自.apply(axis=None) ). 我们还将允许颜色是可调的,以演示.apply和.applymap传递关键字参数.
[10]:
def highlight_max(data, color='yellow'):
    '''
    highlight the maximum in a Series or DataFrame
    '''
    attr = ' color: rgb(112, 160, 208); font-style: italic;">{}'.format(color)
    if data.ndim == 1:  # Series from .apply(axis=0) or axis=1
        is_max = data == data.max()
        return [attr if v else '' for v in is_max]
    else:  # from .apply(axis=None)
        is_max = data == data.max().max()
        return pd.DataFrame(np.where(is_max, attr, ''),
                            index=data.index, columns=data.columns)
使用Styler.apply(func, axis=None) ,该函数必须返回具有相同索引和列标签的DataFrame.
[11]:
df.style.apply(highlight_max, color='darkorange', axis=None)
[11]:
| A | B | C | D | E | |
|---|---|---|---|---|---|
| 0 | 1.000000 | 1.329212 | nan | -0.316280 | -0.990810 |
| 1 | 2.000000 | -1.070816 | -1.438713 | 0.564417 | 0.295722 |
| 2 | 3.000000 | -1.626404 | 0.219565 | 0.678805 | 1.889273 |
| 3 | 4.000000 | 0.961538 | 0.104011 | nan | 0.850229 |
| 4 | 5.000000 | 1.453425 | 1.057737 | 0.165562 | 0.515018 |
| 5 | 6.000000 | -1.336936 | 0.562861 | 1.392855 | -0.063328 |
| 6 | 7.000000 | 0.121668 | 1.207603 | -0.002040 | 1.627796 |
| 7 | 8.000000 | 0.354493 | 1.037528 | -0.385684 | 0.519818 |
| 8 | 9.000000 | 1.686583 | -1.325963 | 1.428984 | -2.089354 |
| 9 | 10.000000 | -0.129820 | 0.631523 | -0.586538 | 0.290720 |
Building Styles Summary
样式函数应返回具有一个或多个CSS attribute: value字符串attribute: value以分号分隔. 用
-
Styler.applymap(func)用于元素样式 -
Styler.apply(func, axis=0)用于列式样式 -
Styler.apply(func, axis=1)用于行样式 -
Styler.apply(func, axis=None)
至关重要的是, func的输入和输出形状必须匹配. 如果x是输入,则func(x).shape == x.shape .
Finer control: slicing
Styler.apply和Styler.applymap接受subset关键字. 这使您可以将样式应用于特定的行或列,而不必将该逻辑编码到style函数中.
传递给subset的值的行为类似于切片DataFrame.
-
标量被视为列标签
-
列表(或系列或numpy数组)
-
A tuple is treated as
(row_indexer, column_indexer)
考虑使用pd.IndexSlice构造最后一个的元组.
[12]:
df.style.apply(highlight_max, subset=['B', 'C', 'D'])
[12]:
| A | B | C | D | E | |
|---|---|---|---|---|---|
| 0 | 1.000000 | 1.329212 | nan | -0.316280 | -0.990810 |
| 1 | 2.000000 | -1.070816 | -1.438713 | 0.564417 | 0.295722 |
| 2 | 3.000000 | -1.626404 | 0.219565 | 0.678805 | 1.889273 |
| 3 | 4.000000 | 0.961538 | 0.104011 | nan | 0.850229 |
| 4 | 5.000000 | 1.453425 | 1.057737 | 0.165562 | 0.515018 |
| 5 | 6.000000 | -1.336936 | 0.562861 | 1.392855 | -0.063328 |
| 6 | 7.000000 | 0.121668 | 1.207603 | -0.002040 | 1.627796 |
| 7 | 8.000000 | 0.354493 | 1.037528 | -0.385684 | 0.519818 |
| 8 | 9.000000 | 1.686583 | -1.325963 | 1.428984 | -2.089354 |
| 9 | 10.000000 | -0.129820 | 0.631523 | -0.586538 | 0.290720 |
对于行和列切片, .loc任何有效索引器都将起作用.
[13]:
df.style.applymap(color_negative_red,
                  subset=pd.IndexSlice[2:5, ['B', 'D']])
[13]:
| A | B | C | D | E | |
|---|---|---|---|---|---|
| 0 | 1.000000 | 1.329212 | nan | -0.316280 | -0.990810 |
| 1 | 2.000000 | -1.070816 | -1.438713 | 0.564417 | 0.295722 |
| 2 | 3.000000 | -1.626404 | 0.219565 | 0.678805 | 1.889273 |
| 3 | 4.000000 | 0.961538 | 0.104011 | nan | 0.850229 |
| 4 | 5.000000 | 1.453425 | 1.057737 | 0.165562 | 0.515018 |
| 5 | 6.000000 | -1.336936 | 0.562861 | 1.392855 | -0.063328 |
| 6 | 7.000000 | 0.121668 | 1.207603 | -0.002040 | 1.627796 |
| 7 | 8.000000 | 0.354493 | 1.037528 | -0.385684 | 0.519818 |
| 8 | 9.000000 | 1.686583 | -1.325963 | 1.428984 | -2.089354 |
| 9 | 10.000000 | -0.129820 | 0.631523 | -0.586538 | 0.290720 |
目前仅支持基于标签的切片,不支持位置切片.
如果您的样式函数使用subset或axis关键字参数,请考虑将函数包装在functools.partial ,以functools.partial该关键字.
my_func2 = functools.partial(my_func, subset=42)
Finer Control: Display Values
我们在Styler中将显示值与实际值区分开. 要控制显示值,请使用Styler.format在每个单元格中打印文本. 可以根据格式规范字符串或采用单个值并返回字符串的可调用对象来格式化单元格.
[14]:
df.style.format("{:.2%}")
[14]:
| A | B | C | D | E | |
|---|---|---|---|---|---|
| 0 | 100.00% | 132.92% | nan% | -31.63% | -99.08% |
| 1 | 200.00% | -107.08% | -143.87% | 56.44% | 29.57% |
| 2 | 300.00% | -162.64% | 21.96% | 67.88% | 188.93% |
| 3 | 400.00% | 96.15% | 10.40% | nan% | 85.02% |
| 4 | 500.00% | 145.34% | 105.77% | 16.56% | 51.50% |
| 5 | 600.00% | -133.69% | 56.29% | 139.29% | -6.33% |
| 6 | 700.00% | 12.17% | 120.76% | -0.20% | 162.78% |
| 7 | 800.00% | 35.45% | 103.75% | -38.57% | 51.98% |
| 8 | 900.00% | 168.66% | -132.60% | 142.90% | -208.94% |
| 9 | 1000.00% | -12.98% | 63.15% | -58.65% | 29.07% |
使用字典来格式化特定的列.
[15]:
df.style.format({'B': "{:0<4.0f}", 'D': '{:+.2f}'})
[15]:
| A | B | C | D | E | |
|---|---|---|---|---|---|
| 0 | 1.000000 | 1000 | nan | -0.32 | -0.990810 |
| 1 | 2.000000 | -100 | -1.438713 | +0.56 | 0.295722 |
| 2 | 3.000000 | -200 | 0.219565 | +0.68 | 1.889273 |
| 3 | 4.000000 | 1000 | 0.104011 | +nan | 0.850229 |
| 4 | 5.000000 | 1000 | 1.057737 | +0.17 | 0.515018 |
| 5 | 6.000000 | -100 | 0.562861 | +1.39 | -0.063328 |
| 6 | 7.000000 | 0000 | 1.207603 | -0.00 | 1.627796 |
| 7 | 8.000000 | 0000 | 1.037528 | -0.39 | 0.519818 |
| 8 | 9.000000 | 2000 | -1.325963 | +1.43 | -2.089354 |
| 9 | 10.000000 | -000 | 0.631523 | -0.59 | 0.290720 |
或传入可调用对象(或可调用字典)以更灵活地处理.
[16]:
df.style.format({"B": lambda x: "±{:.2f}".format(abs(x))})
[16]:
| A | B | C | D | E | |
|---|---|---|---|---|---|
| 0 | 1.000000 | ±1.33 | nan | -0.316280 | -0.990810 |
| 1 | 2.000000 | ±1.07 | -1.438713 | 0.564417 | 0.295722 |
| 2 | 3.000000 | ±1.63 | 0.219565 | 0.678805 | 1.889273 |
| 3 | 4.000000 | ±0.96 | 0.104011 | nan | 0.850229 |
| 4 | 5.000000 | ±1.45 | 1.057737 | 0.165562 | 0.515018 |
| 5 | 6.000000 | ±1.34 | 0.562861 | 1.392855 | -0.063328 |
| 6 | 7.000000 | ±0.12 | 1.207603 | -0.002040 | 1.627796 |
| 7 | 8.000000 | ±0.35 | 1.037528 | -0.385684 | 0.519818 |
| 8 | 9.000000 | ±1.69 | -1.325963 | 1.428984 | -2.089354 |
| 9 | 10.000000 | ±0.13 | 0.631523 | -0.586538 | 0.290720 |
您可以通过na_rep格式化显示为缺少值的na_rep .
[17]:
df.style.format("{:.2%}", na_rep="-")
[17]:
| A | B | C | D | E | |
|---|---|---|---|---|---|
| 0 | 100.00% | 132.92% | - | -31.63% | -99.08% |
| 1 | 200.00% | -107.08% | -143.87% | 56.44% | 29.57% |
| 2 | 300.00% | -162.64% | 21.96% | 67.88% | 188.93% |
| 3 | 400.00% | 96.15% | 10.40% | - | 85.02% |
| 4 | 500.00% | 145.34% | 105.77% | 16.56% | 51.50% |
| 5 | 600.00% | -133.69% | 56.29% | 139.29% | -6.33% |
| 6 | 700.00% | 12.17% | 120.76% | -0.20% | 162.78% |
| 7 | 800.00% | 35.45% | 103.75% | -38.57% | 51.98% |
| 8 | 900.00% | 168.66% | -132.60% | 142.90% | -208.94% |
| 9 | 1000.00% | -12.98% | 63.15% | -58.65% | 29.07% |
这些格式化技术可以与样式结合使用.
[18]:
df.style.highlight_max().format(None, na_rep="-")
[18]:
| A | B | C | D | E | |
|---|---|---|---|---|---|
| 0 | 1.000000 | 1.329212 | - | -0.316280 | -0.990810 |
| 1 | 2.000000 | -1.070816 | -1.438713 | 0.564417 | 0.295722 |
| 2 | 3.000000 | -1.626404 | 0.219565 | 0.678805 | 1.889273 |
| 3 | 4.000000 | 0.961538 | 0.104011 | - | 0.850229 |
| 4 | 5.000000 | 1.453425 | 1.057737 | 0.165562 | 0.515018 |
| 5 | 6.000000 | -1.336936 | 0.562861 | 1.392855 | -0.063328 |
| 6 | 7.000000 | 0.121668 | 1.207603 | -0.002040 | 1.627796 |
| 7 | 8.000000 | 0.354493 | 1.037528 | -0.385684 | 0.519818 |
| 8 | 9.000000 | 1.686583 | -1.325963 | 1.428984 | -2.089354 |
| 9 | 10.000000 | -0.129820 | 0.631523 | -0.586538 | 0.290720 |
Builtin styles
最后,我们希望某些样式功能足够通用,以至于我们在Styler包括了一些"内置"功能,因此您不必自己编写它们.
[19]:
df.style.highlight_null(null_color='red')
[19]:
| A | B | C | D | E | |
|---|---|---|---|---|---|
| 0 | 1.000000 | 1.329212 | nan | -0.316280 | -0.990810 |
| 1 | 2.000000 | -1.070816 | -1.438713 | 0.564417 | 0.295722 |
| 2 | 3.000000 | -1.626404 | 0.219565 | 0.678805 | 1.889273 |
| 3 | 4.000000 | 0.961538 | 0.104011 | nan | 0.850229 |
| 4 | 5.000000 | 1.453425 | 1.057737 | 0.165562 | 0.515018 |
| 5 | 6.000000 | -1.336936 | 0.562861 | 1.392855 | -0.063328 |
| 6 | 7.000000 | 0.121668 | 1.207603 | -0.002040 | 1.627796 |
| 7 | 8.000000 | 0.354493 | 1.037528 | -0.385684 | 0.519818 |
| 8 | 9.000000 | 1.686583 | -1.325963 | 1.428984 | -2.089354 |
| 9 | 10.000000 | -0.129820 | 0.631523 | -0.586538 | 0.290720 |
您可以使用background_gradient方法创建"热图". 这些需要matplotlib,我们将使用Seaborn获得漂亮的色彩图.
[20]:
import seaborn as sns

cm = sns.light_palette("green", as_cmap=True)

s = df.style.background_gradient(cmap=cm)
s
[20]:
| A | B | C | D | E | |
|---|---|---|---|---|---|
| 0 | 1.000000 | 1.329212 | nan | -0.316280 | -0.990810 |
| 1 | 2.000000 | -1.070816 | -1.438713 | 0.564417 | 0.295722 |
| 2 | 3.000000 | -1.626404 | 0.219565 | 0.678805 | 1.889273 |
| 3 | 4.000000 | 0.961538 | 0.104011 | nan | 0.850229 |
| 4 | 5.000000 | 1.453425 | 1.057737 | 0.165562 | 0.515018 |
| 5 | 6.000000 | -1.336936 | 0.562861 | 1.392855 | -0.063328 |
| 6 | 7.000000 | 0.121668 | 1.207603 | -0.002040 | 1.627796 |
| 7 | 8.000000 | 0.354493 | 1.037528 | -0.385684 | 0.519818 |
| 8 | 9.000000 | 1.686583 | -1.325963 | 1.428984 | -2.089354 |
| 9 | 10.000000 | -0.129820 | 0.631523 | -0.586538 | 0.290720 |
Styler.background_gradient使用关键字参数low和high . 粗略地说,这些将数据范围扩大了low百分比和high百分比,因此,当我们转换颜色时,不会使用颜色图的整个范围. 这很有用,因此您实际上仍可以阅读文本.
[21]:
# Uses the full color range
df.loc[:4].style.background_gradient(cmap='viridis')
[21]:
| A | B | C | D | E | |
|---|---|---|---|---|---|
| 0 | 1.000000 | 1.329212 | nan | -0.316280 | -0.990810 |
| 1 | 2.000000 | -1.070816 | -1.438713 | 0.564417 | 0.295722 |
| 2 | 3.000000 | -1.626404 | 0.219565 | 0.678805 | 1.889273 |
| 3 | 4.000000 | 0.961538 | 0.104011 | nan | 0.850229 |
| 4 | 5.000000 | 1.453425 | 1.057737 | 0.165562 | 0.515018 |
[22]:
# Compress the color range
(df.loc[:4]
    .style
    .background_gradient(cmap='viridis', low=.5, high=0)
    .highlight_null('red'))
[22]:
| A | B | C | D | E | |
|---|---|---|---|---|---|
| 0 | 1.000000 | 1.329212 | nan | -0.316280 | -0.990810 |
| 1 | 2.000000 | -1.070816 | -1.438713 | 0.564417 | 0.295722 |
| 2 | 3.000000 | -1.626404 | 0.219565 | 0.678805 | 1.889273 |
| 3 | 4.000000 | 0.961538 | 0.104011 | nan | 0.850229 |
| 4 | 5.000000 | 1.453425 | 1.057737 | 0.165562 | 0.515018 |
还有.highlight_min和.highlight_max .
[23]:
df.style.highlight_max(axis=0)
[23]:
| A | B | C | D | E | |
|---|---|---|---|---|---|
| 0 | 1.000000 | 1.329212 | nan | -0.316280 | -0.990810 |
| 1 | 2.000000 | -1.070816 | -1.438713 | 0.564417 | 0.295722 |
| 2 | 3.000000 | -1.626404 | 0.219565 | 0.678805 | 1.889273 |
| 3 | 4.000000 | 0.961538 | 0.104011 | nan | 0.850229 |
| 4 | 5.000000 | 1.453425 | 1.057737 | 0.165562 | 0.515018 |
| 5 | 6.000000 | -1.336936 | 0.562861 | 1.392855 | -0.063328 |
| 6 | 7.000000 | 0.121668 | 1.207603 | -0.002040 | 1.627796 |
| 7 | 8.000000 | 0.354493 | 1.037528 | -0.385684 | 0.519818 |
| 8 | 9.000000 | 1.686583 | -1.325963 | 1.428984 | -2.089354 |
| 9 | 10.000000 | -0.129820 | 0.631523 | -0.586538 | 0.290720 |
当样式实际上不依赖于值时,请使用Styler.set_properties .
[24]:
df.style.set_properties(**{'background-color': 'black',
                           'color': 'lawngreen',
                           'border-color': 'white'})
[24]:
| A | B | C | D | E | |
|---|---|---|---|---|---|
| 0 | 1.000000 | 1.329212 | nan | -0.316280 | -0.990810 |
| 1 | 2.000000 | -1.070816 | -1.438713 | 0.564417 | 0.295722 |
| 2 | 3.000000 | -1.626404 | 0.219565 | 0.678805 | 1.889273 |
| 3 | 4.000000 | 0.961538 | 0.104011 | nan | 0.850229 |
| 4 | 5.000000 | 1.453425 | 1.057737 | 0.165562 | 0.515018 |
| 5 | 6.000000 | -1.336936 | 0.562861 | 1.392855 | -0.063328 |
| 6 | 7.000000 | 0.121668 | 1.207603 | -0.002040 | 1.627796 |
| 7 | 8.000000 | 0.354493 | 1.037528 | -0.385684 | 0.519818 |
| 8 | 9.000000 | 1.686583 | -1.325963 | 1.428984 | -2.089354 |
| 9 | 10.000000 | -0.129820 | 0.631523 | -0.586538 | 0.290720 |
Bar charts
您可以在数据框架中包含"条形图".
[25]:
df.style.bar(subset=['A', 'B'], color='#d65f5f')
[25]:
| A | B | C | D | E | |
|---|---|---|---|---|---|
| 0 | 1.000000 | 1.329212 | nan | -0.316280 | -0.990810 |
| 1 | 2.000000 | -1.070816 | -1.438713 | 0.564417 | 0.295722 |
| 2 | 3.000000 | -1.626404 | 0.219565 | 0.678805 | 1.889273 |
| 3 | 4.000000 | 0.961538 | 0.104011 | nan | 0.850229 |
| 4 | 5.000000 | 1.453425 | 1.057737 | 0.165562 | 0.515018 |
| 5 | 6.000000 | -1.336936 | 0.562861 | 1.392855 | -0.063328 |
| 6 | 7.000000 | 0.121668 | 1.207603 | -0.002040 | 1.627796 |
| 7 | 8.000000 | 0.354493 | 1.037528 | -0.385684 | 0.519818 |
| 8 | 9.000000 | 1.686583 | -1.325963 | 1.428984 | -2.089354 |
| 9 | 10.000000 | -0.129820 | 0.631523 | -0.586538 | 0.290720 |
0.20.0版中的新功能是可以进一步自定义条形图:现在,您可以使df.style.bar以零或中点值为中心(除了已经存在的在左侧具有最小值的方法之外)单元格),您可以传递[color_negative, color_positive]列表.
您可以使用新的align='mid'选项更改上述内容:
[26]:
df.style.bar(subset=['A', 'B'], align='mid', color=['#d65f5f', '#5fba7d'])
[26]:
| A | B | C | D | E | |
|---|---|---|---|---|---|
| 0 | 1.000000 | 1.329212 | nan | -0.316280 | -0.990810 |
| 1 | 2.000000 | -1.070816 | -1.438713 | 0.564417 | 0.295722 |
| 2 | 3.000000 | -1.626404 | 0.219565 | 0.678805 | 1.889273 |
| 3 | 4.000000 | 0.961538 | 0.104011 | nan | 0.850229 |
| 4 | 5.000000 | 1.453425 | 1.057737 | 0.165562 | 0.515018 |
| 5 | 6.000000 | -1.336936 | 0.562861 | 1.392855 | -0.063328 |
| 6 | 7.000000 | 0.121668 | 1.207603 | -0.002040 | 1.627796 |
| 7 | 8.000000 | 0.354493 | 1.037528 | -0.385684 | 0.519818 |
| 8 | 9.000000 | 1.686583 | -1.325963 | 1.428984 | -2.089354 |
| 9 | 10.000000 | -0.129820 | 0.631523 | -0.586538 | 0.290720 |
以下示例旨在突出显示新的align选项的行为:
[27]:
import pandas as pd
from IPython.display import HTML

# Test series
test1 = pd.Series([-100,-60,-30,-20], name='All Negative')
test2 = pd.Series([10,20,50,100], name='All Positive')
test3 = pd.Series([-10,-5,0,90], name='Both Pos and Neg')

head = """
<table>
    <thead>
        <th>Align</th>
        <th>All Negative</th>
        <th>All Positive</th>
        <th>Both Neg and Pos</th>
    </thead>
    </tbody>

"""

aligns = ['left','zero','mid']
for align in aligns:
    row = "<tr><th>{}</th>".format(align)
    for serie in [test1,test2,test3]:
        s = serie.copy()
        s.name=''
        row += "<td>{}</td>".format(s.to_frame().style.bar(align=align,
                                                           color=['#d65f5f', '#5fba7d'],
                                                           width=100).render()) #testn['width']
    row += '</tr>'
    head += row

head+= """
</tbody>
</table>"""


HTML(head)
[27]:
| Align | 全部为负 | 全部正面 | Neg和Pos | ||||||||||||||||||||||||||||||
|---|---|---|---|---|---|---|---|---|---|---|---|---|---|---|---|---|---|---|---|---|---|---|---|---|---|---|---|---|---|---|---|---|---|
| left |
|
|
|
||||||||||||||||||||||||||||||
| zero |
|
|
|
||||||||||||||||||||||||||||||
| mid |
|
|
|
Sharing styles
假设您为DataFrame建立了一个可爱的样式,现在您想将相同样式应用于第二个DataFrame. 使用df1.style.export导出样式,然后使用df1.style.export在第二个DataFrame上df1.style.set
[28]:
df2 = -df
style1 = df.style.applymap(color_negative_red)
style1
[28]:
| A | B | C | D | E | |
|---|---|---|---|---|---|
| 0 | 1.000000 | 1.329212 | nan | -0.316280 | -0.990810 |
| 1 | 2.000000 | -1.070816 | -1.438713 | 0.564417 | 0.295722 |
| 2 | 3.000000 | -1.626404 | 0.219565 | 0.678805 | 1.889273 |
| 3 | 4.000000 | 0.961538 | 0.104011 | nan | 0.850229 |
| 4 | 5.000000 | 1.453425 | 1.057737 | 0.165562 | 0.515018 |
| 5 | 6.000000 | -1.336936 | 0.562861 | 1.392855 | -0.063328 |
| 6 | 7.000000 | 0.121668 | 1.207603 | -0.002040 | 1.627796 |
| 7 | 8.000000 | 0.354493 | 1.037528 | -0.385684 | 0.519818 |
| 8 | 9.000000 | 1.686583 | -1.325963 | 1.428984 | -2.089354 |
| 9 | 10.000000 | -0.129820 | 0.631523 | -0.586538 | 0.290720 |
[29]:
style2 = df2.style
style2.use(style1.export())
style2
[29]:
| A | B | C | D | E | |
|---|---|---|---|---|---|
| 0 | -1.000000 | -1.329212 | nan | 0.316280 | 0.990810 |
| 1 | -2.000000 | 1.070816 | 1.438713 | -0.564417 | -0.295722 |
| 2 | -3.000000 | 1.626404 | -0.219565 | -0.678805 | -1.889273 |
| 3 | -4.000000 | -0.961538 | -0.104011 | nan | -0.850229 |
| 4 | -5.000000 | -1.453425 | -1.057737 | -0.165562 | -0.515018 |
| 5 | -6.000000 | 1.336936 | -0.562861 | -1.392855 | 0.063328 |
| 6 | -7.000000 | -0.121668 | -1.207603 | 0.002040 | -1.627796 |
| 7 | -8.000000 | -0.354493 | -1.037528 | 0.385684 | -0.519818 |
| 8 | -9.000000 | -1.686583 | 1.325963 | -1.428984 | 2.089354 |
| 9 | -10.000000 | 0.129820 | -0.631523 | 0.586538 | -0.290720 |
请注意,即使样式可以识别数据,您也可以共享它们. 在use过的新DataFrame上重新评估样式.
Other Options
您已经看到了几种用于数据驱动的样式的方法. Styler还为不依赖数据的样式提供了其他一些选项.
-
precision
-
captions
-
表格样式
-
缺失值表示
-
隐藏索引或列
可以通过两种方式指定每一个:
-
Styler.__init__的关键字参数Styler.__init__ -
调用
.set_或.hide_方法之一,例如.set_caption或.hide_columns
最佳使用方法取决于上下文. 构建许多应共享相同属性的样式化DataFrame时,请使用Styler构造函数. 对于交互式使用, .set_和.hide_方法更方便.
Precision
您可以使用熊猫的常规display.precision选项控制浮标的精度.
[30]:
with pd.option_context('display.precision', 2):
    html = (df.style
              .applymap(color_negative_red)
              .apply(highlight_max))
html
[30]:
| A | B | C | D | E | |
|---|---|---|---|---|---|
| 0 | 1.00 | 1.33 | nan | -0.32 | -0.99 |
| 1 | 2.00 | -1.07 | -1.44 | 0.56 | 0.30 |
| 2 | 3.00 | -1.63 | 0.22 | 0.68 | 1.89 |
| 3 | 4.00 | 0.96 | 0.10 | nan | 0.85 |
| 4 | 5.00 | 1.45 | 1.06 | 0.17 | 0.52 |
| 5 | 6.00 | -1.34 | 0.56 | 1.39 | -0.06 |
| 6 | 7.00 | 0.12 | 1.21 | -0.00 | 1.63 |
| 7 | 8.00 | 0.35 | 1.04 | -0.39 | 0.52 |
| 8 | 9.00 | 1.69 | -1.33 | 1.43 | -2.09 |
| 9 | 10.00 | -0.13 | 0.63 | -0.59 | 0.29 |
或通过set_precision方法.
[31]:
df.style
  .applymap(color_negative_red)
  .apply(highlight_max)
  .set_precision(2)
[31]:
| A | B | C | D | E | |
|---|---|---|---|---|---|
| 0 | 1.00 | 1.33 | nan | -0.32 | -0.99 |
| 1 | 2.00 | -1.07 | -1.44 | 0.56 | 0.30 |
| 2 | 3.00 | -1.63 | 0.22 | 0.68 | 1.89 |
| 3 | 4.00 | 0.96 | 0.10 | nan | 0.85 |
| 4 | 5.00 | 1.45 | 1.06 | 0.17 | 0.52 |
| 5 | 6.00 | -1.34 | 0.56 | 1.39 | -0.06 |
| 6 | 7.00 | 0.12 | 1.21 | -0.00 | 1.63 |
| 7 | 8.00 | 0.35 | 1.04 | -0.39 | 0.52 |
| 8 | 9.00 | 1.69 | -1.33 | 1.43 | -2.09 |
| 9 | 10.00 | -0.13 | 0.63 | -0.59 | 0.29 |
设置精度仅影响打印数量; 全精度值始终传递给样式函数. 如果您希望从头开始四舍五入,则可以始终使用df.round(2).style .
Captions
常规表格标题可以通过几种方式添加.
[32]:
df.style.set_caption('Colormaps, with a caption.')
    .background_gradient(cmap=cm)
[32]:
| A | B | C | D | E | |
|---|---|---|---|---|---|
| 0 | 1.000000 | 1.329212 | nan | -0.316280 | -0.990810 |
| 1 | 2.000000 | -1.070816 | -1.438713 | 0.564417 | 0.295722 |
| 2 | 3.000000 | -1.626404 | 0.219565 | 0.678805 | 1.889273 |
| 3 | 4.000000 | 0.961538 | 0.104011 | nan | 0.850229 |
| 4 | 5.000000 | 1.453425 | 1.057737 | 0.165562 | 0.515018 |
| 5 | 6.000000 | -1.336936 | 0.562861 | 1.392855 | -0.063328 |
| 6 | 7.000000 | 0.121668 | 1.207603 | -0.002040 | 1.627796 |
| 7 | 8.000000 | 0.354493 | 1.037528 | -0.385684 | 0.519818 |
| 8 | 9.000000 | 1.686583 | -1.325963 | 1.428984 | -2.089354 |
| 9 | 10.000000 | -0.129820 | 0.631523 | -0.586538 | 0.290720 |
Table styles
下一个选项是"表格样式". 这些样式适用于整个表格,但不查看数据. 某些样式,包括伪选择器(如:hover只能以这种方式使用.
[33]:
from IPython.display import HTML

def hover(hover_color="#ffff99"):
    return dict(selector="tr:hover",
                props=[("background-color", "%s" % hover_color)])

styles = [
    hover(),
    dict(selector="th", props=[("font-size", "150%"),
                               ("text-align", "center")]),
    dict(selector="caption", props=[("caption-side", "bottom")])
]
html = (df.style.set_table_styles(styles)
          .set_caption("Hover to highlight."))
html
[33]:
| A | B | C | D | E | |
|---|---|---|---|---|---|
| 0 | 1.000000 | 1.329212 | nan | -0.316280 | -0.990810 |
| 1 | 2.000000 | -1.070816 | -1.438713 | 0.564417 | 0.295722 |
| 2 | 3.000000 | -1.626404 | 0.219565 | 0.678805 | 1.889273 |
| 3 | 4.000000 | 0.961538 | 0.104011 | nan | 0.850229 |
| 4 | 5.000000 | 1.453425 | 1.057737 | 0.165562 | 0.515018 |
| 5 | 6.000000 | -1.336936 | 0.562861 | 1.392855 | -0.063328 |
| 6 | 7.000000 | 0.121668 | 1.207603 | -0.002040 | 1.627796 |
| 7 | 8.000000 | 0.354493 | 1.037528 | -0.385684 | 0.519818 |
| 8 | 9.000000 | 1.686583 | -1.325963 | 1.428984 | -2.089354 |
| 9 | 10.000000 | -0.129820 | 0.631523 | -0.586538 | 0.290720 |
table_styles应该是词典列表. 每个字典应具有selector和props键. selector的值应为有效的CSS选择器. 回想一下,所有样式已经附加到每个Styler唯一的id . 此选择器是该id之外的选择器. props的值应为('attribute', 'value')的元组列表.
table_styles非常灵活,但是手动键入却不那么有趣. 我们希望以大熊猫的形式收集一些有用的信息,或者以基于此处工具的新软件包的形式收集一些有用的信息.
Missing values
您可以通过set_na_rep方法控制整个表的默认缺失值表示.
[34]:
(df.style
   .set_na_rep("FAIL")
   .format(None, na_rep="PASS", subset=["D"])
   .highlight_null("yellow"))
[34]:
| A | B | C | D | E | |
|---|---|---|---|---|---|
| 0 | 1.000000 | 1.329212 | FAIL | -0.316280 | -0.990810 |
| 1 | 2.000000 | -1.070816 | -1.438713 | 0.564417 | 0.295722 |
| 2 | 3.000000 | -1.626404 | 0.219565 | 0.678805 | 1.889273 |
| 3 | 4.000000 | 0.961538 | 0.104011 | PASS | 0.850229 |
| 4 | 5.000000 | 1.453425 | 1.057737 | 0.165562 | 0.515018 |
| 5 | 6.000000 | -1.336936 | 0.562861 | 1.392855 | -0.063328 |
| 6 | 7.000000 | 0.121668 | 1.207603 | -0.002040 | 1.627796 |
| 7 | 8.000000 | 0.354493 | 1.037528 | -0.385684 | 0.519818 |
| 8 | 9.000000 | 1.686583 | -1.325963 | 1.428984 | -2.089354 |
| 9 | 10.000000 | -0.129820 | 0.631523 | -0.586538 | 0.290720 |
Hiding the Index or Columns
可以通过调用Styler.hide_index隐藏该索引以使其无法呈现. 可以通过调用Styler.hide_columns并传入一列或列的一部分的名称来隐藏列,以免呈现.
[35]:
df.style.hide_index()
[35]:
| A | B | C | D | E |
|---|---|---|---|---|
| 1.000000 | 1.329212 | nan | -0.316280 | -0.990810 |
| 2.000000 | -1.070816 | -1.438713 | 0.564417 | 0.295722 |
| 3.000000 | -1.626404 | 0.219565 | 0.678805 | 1.889273 |
| 4.000000 | 0.961538 | 0.104011 | nan | 0.850229 |
| 5.000000 | 1.453425 | 1.057737 | 0.165562 | 0.515018 |
| 6.000000 | -1.336936 | 0.562861 | 1.392855 | -0.063328 |
| 7.000000 | 0.121668 | 1.207603 | -0.002040 | 1.627796 |
| 8.000000 | 0.354493 | 1.037528 | -0.385684 | 0.519818 |
| 9.000000 | 1.686583 | -1.325963 | 1.428984 | -2.089354 |
| 10.000000 | -0.129820 | 0.631523 | -0.586538 | 0.290720 |
[36]:
df.style.hide_columns(['C','D'])
[36]:
| A | B | E | |
|---|---|---|---|
| 0 | 1.000000 | 1.329212 | -0.990810 |
| 1 | 2.000000 | -1.070816 | 0.295722 |
| 2 | 3.000000 | -1.626404 | 1.889273 |
| 3 | 4.000000 | 0.961538 | 0.850229 |
| 4 | 5.000000 | 1.453425 | 0.515018 |
| 5 | 6.000000 | -1.336936 | -0.063328 |
| 6 | 7.000000 | 0.121668 | 1.627796 |
| 7 | 8.000000 | 0.354493 | 0.519818 |
| 8 | 9.000000 | 1.686583 | -2.089354 |
| 9 | 10.000000 | -0.129820 | 0.290720 |
CSS classes
某些CSS类已附加到单元格.
-
索引和列名称包括
index_name和level<k>,其中k是其在MultiIndex中的级别 -
索引标签单元包括
-
row_heading -
row<n>其中,n是行的数字位置 -
level<k>,其中k是MultiIndex中的级别
-
-
列标签单元格包括
-
col_heading -
col<n>wherenis the numeric position of the column -
level<k>,其中k是MultiIndex中的级别
-
-
空白单元格包括
blank -
数据单元格包含
data
Limitations
-
仅限DataFrame
(use Series.to_frame().style) -
索引和列必须唯一
-
没有大的代表,性能也不是很好; 这旨在用于摘要DataFrames
-
您只能设置值的样式,不能设置索引或列的样式
-
您只能应用样式,不能插入新的HTML实体
其中一些将在以后解决.
Terms
-
Style function: a function that’s passed into
Styler.applyorStyler.applymapand returns values like'css attribute: value' -
内置样式函数:作为
Styler上方法的样式函数 -
表格样式:具有两个键
selector和props的字典.selector是props将应用到的CSS选择器.props是(attribute, value)元组的列表. 传递给Styler的表格样式的列表.
Fun stuff
这是一些有趣的例子.
Styler与小部件的交互非常好. 如果您正在在线查看此内容,而不是自己运行笔记本,则可能会错过交互式调整调色板的机会.
[37]:
from IPython.html import widgets
@widgets.interact
def f(h_neg=(0, 359, 1), h_pos=(0, 359), s=(0., 99.9), l=(0., 99.9)):
    return df.style.background_gradient(
        cmap=sns.palettes.diverging_palette(h_neg=h_neg, h_pos=h_pos, s=s, l=l,
                                            as_cmap=True)
    )
| A | B | C | D | E | |
|---|---|---|---|---|---|
| 0 | 1.000000 | 1.329212 | nan | -0.316280 | -0.990810 |
| 1 | 2.000000 | -1.070816 | -1.438713 | 0.564417 | 0.295722 |
| 2 | 3.000000 | -1.626404 | 0.219565 | 0.678805 | 1.889273 |
| 3 | 4.000000 | 0.961538 | 0.104011 | nan | 0.850229 |
| 4 | 5.000000 | 1.453425 | 1.057737 | 0.165562 | 0.515018 |
| 5 | 6.000000 | -1.336936 | 0.562861 | 1.392855 | -0.063328 |
| 6 | 7.000000 | 0.121668 | 1.207603 | -0.002040 | 1.627796 |
| 7 | 8.000000 | 0.354493 | 1.037528 | -0.385684 | 0.519818 |
| 8 | 9.000000 | 1.686583 | -1.325963 | 1.428984 | -2.089354 |
| 9 | 10.000000 | -0.129820 | 0.631523 | -0.586538 | 0.290720 |
[38]:
def magnify():
    return [dict(selector="th",
                 props=[("font-size", "4pt")]),
            dict(selector="td",
                 props=[('padding', "0em 0em")]),
            dict(selector="th:hover",
                 props=[("font-size", "12pt")]),
            dict(selector="tr:hover td:hover",
                 props=[('max-width', '200px'),
                        ('font-size', '12pt')])
]
[39]:
np.random.seed(25)
cmap = cmap=sns.diverging_palette(5, 250, as_cmap=True)
bigdf = pd.DataFrame(np.random.randn(20, 25)).cumsum()

bigdf.style.background_gradient(cmap, axis=1)
    .set_properties(**{'max-width': '80px', 'font-size': '1pt'})
    .set_caption("Hover to magnify")
    .set_precision(2)
    .set_table_styles(magnify())
[39]:
| 0 | 1 | 2 | 3 | 4 | 5 | 6 | 7 | 8 | 9 | 10 | 11 | 12 | 13 | 14 | 15 | 16 | 17 | 18 | 19 | 20 | 21 | 22 | 23 | 24 | |
|---|---|---|---|---|---|---|---|---|---|---|---|---|---|---|---|---|---|---|---|---|---|---|---|---|---|
| 0 | 0.23 | 1.03 | -0.84 | -0.59 | -0.96 | -0.22 | -0.62 | 1.84 | -2.05 | 0.87 | -0.92 | -0.23 | 2.15 | -1.33 | 0.08 | -1.25 | 1.20 | -1.05 | 1.06 | -0.42 | 2.29 | -2.59 | 2.82 | 0.68 | -1.58 |
| 1 | -1.75 | 1.56 | -1.13 | -1.10 | 1.03 | 0.00 | -2.46 | 3.45 | -1.66 | 1.27 | -0.52 | -0.02 | 1.52 | -1.09 | -1.86 | -1.13 | -0.68 | -0.81 | 0.35 | -0.06 | 1.79 | -2.82 | 2.26 | 0.78 | 0.44 |
| 2 | -0.65 | 3.22 | -1.76 | 0.52 | 2.20 | -0.37 | -3.00 | 3.73 | -1.87 | 2.46 | 0.21 | -0.24 | -0.10 | -0.78 | -3.02 | -0.82 | -0.21 | -0.23 | 0.86 | -0.68 | 1.45 | -4.89 | 3.03 | 1.91 | 0.61 |
| 3 | -1.62 | 3.71 | -2.31 | 0.43 | 4.17 | -0.43 | -3.86 | 4.16 | -2.15 | 1.08 | 0.12 | 0.60 | -0.89 | 0.27 | -3.67 | -2.71 | -0.31 | -1.59 | 1.35 | -1.83 | 0.91 | -5.80 | 2.81 | 2.11 | 0.28 |
| 4 | -3.35 | 4.48 | -1.86 | -1.70 | 5.19 | -1.02 | -3.81 | 4.72 | -0.72 | 1.08 | -0.18 | 0.83 | -0.22 | -1.08 | -4.27 | -2.88 | -0.97 | -1.78 | 1.53 | -1.80 | 2.21 | -6.34 | 3.34 | 2.49 | 2.09 |
| 5 | -0.84 | 4.23 | -1.65 | -2.00 | 5.34 | -0.99 | -4.13 | 3.94 | -1.06 | -0.94 | 1.24 | 0.09 | -1.78 | -0.11 | -4.45 | -0.85 | -2.06 | -1.35 | 0.80 | -1.63 | 1.54 | -6.51 | 2.80 | 2.14 | 3.77 |
| 6 | -0.74 | 5.35 | -2.11 | -1.13 | 4.20 | -1.85 | -3.20 | 3.76 | -3.22 | -1.23 | 0.34 | 0.57 | -1.82 | 0.54 | -4.43 | -1.83 | -4.03 | -2.62 | -0.20 | -4.68 | 1.93 | -8.46 | 3.34 | 2.52 | 5.81 |
| 7 | -0.44 | 4.69 | -2.30 | -0.21 | 5.93 | -2.63 | -1.83 | 5.46 | -4.50 | -3.16 | -1.73 | 0.18 | 0.11 | 0.04 | -5.99 | -0.45 | -6.20 | -3.89 | 0.71 | -3.95 | 0.67 | -7.26 | 2.97 | 3.39 | 6.66 |
| 8 | 0.92 | 5.80 | -3.33 | -0.65 | 5.99 | -3.19 | -1.83 | 5.63 | -3.53 | -1.30 | -1.61 | 0.82 | -2.45 | -0.40 | -6.06 | -0.52 | -6.60 | -3.48 | -0.04 | -4.60 | 0.51 | -5.85 | 3.23 | 2.40 | 5.08 |
| 9 | 0.38 | 5.54 | -4.49 | -0.80 | 7.05 | -2.64 | -0.44 | 5.35 | -1.96 | -0.33 | -0.80 | 0.26 | -3.37 | -0.82 | -6.05 | -2.61 | -8.45 | -4.45 | 0.41 | -4.71 | 1.89 | -6.93 | 2.14 | 3.00 | 5.16 |
| 10 | 2.06 | 5.84 | -3.90 | -0.98 | 7.78 | -2.49 | -0.59 | 5.59 | -2.22 | -0.71 | -0.46 | 1.80 | -2.79 | 0.48 | -5.97 | -3.44 | -7.77 | -5.49 | -0.70 | -4.61 | -0.52 | -7.72 | 1.54 | 5.02 | 5.81 |
| 11 | 1.86 | 4.47 | -2.17 | -1.38 | 5.90 | -0.49 | 0.02 | 5.78 | -1.04 | -0.60 | 0.49 | 1.96 | -1.47 | 1.88 | -5.92 | -4.55 | -8.15 | -3.42 | -2.24 | -4.33 | -1.17 | -7.90 | 1.36 | 5.31 | 5.83 |
| 12 | 3.19 | 4.22 | -3.06 | -2.27 | 5.93 | -2.64 | 0.33 | 6.72 | -2.84 | -0.20 | 1.89 | 2.63 | -1.53 | 0.75 | -5.27 | -4.53 | -7.57 | -2.85 | -2.17 | -4.78 | -1.13 | -8.99 | 2.11 | 6.42 | 5.60 |
| 13 | 2.31 | 4.45 | -3.87 | -2.05 | 6.76 | -3.25 | -2.17 | 7.99 | -2.56 | -0.80 | 0.71 | 2.33 | -0.16 | -0.46 | -5.10 | -3.79 | -7.58 | -4.00 | 0.33 | -3.67 | -1.05 | -8.71 | 2.47 | 5.87 | 6.71 |
| 14 | 3.78 | 4.33 | -3.88 | -1.58 | 6.22 | -3.23 | -1.46 | 5.57 | -2.93 | -0.33 | -0.97 | 1.72 | 3.61 | 0.29 | -4.21 | -4.10 | -6.68 | -4.50 | -2.19 | -2.43 | -1.64 | -9.36 | 3.36 | 6.11 | 7.53 |
| 15 | 5.64 | 5.31 | -3.98 | -2.26 | 5.91 | -3.30 | -1.03 | 5.68 | -3.06 | -0.33 | -1.16 | 2.19 | 4.20 | 1.01 | -3.22 | -4.31 | -5.74 | -4.44 | -2.30 | -1.36 | -1.20 | -11.27 | 2.59 | 6.69 | 5.91 |
| 16 | 4.08 | 4.34 | -2.44 | -3.30 | 6.04 | -2.52 | -0.47 | 5.28 | -4.84 | 1.58 | 0.23 | 0.10 | 5.79 | 1.80 | -3.13 | -3.85 | -5.53 | -2.97 | -2.13 | -1.15 | -0.56 | -13.13 | 2.07 | 6.16 | 4.94 |
| 17 | 5.64 | 4.57 | -3.53 | -3.76 | 6.58 | -2.58 | -0.75 | 6.58 | -4.78 | 3.63 | -0.29 | 0.56 | 5.76 | 2.05 | -2.27 | -2.31 | -4.95 | -3.16 | -3.06 | -2.43 | 0.84 | -12.57 | 3.56 | 7.36 | 4.70 |
| 18 | 5.99 | 5.82 | -2.85 | -4.15 | 7.12 | -3.32 | -1.21 | 7.93 | -4.85 | 1.44 | -0.63 | 0.35 | 7.47 | 0.87 | -1.52 | -2.09 | -4.23 | -2.55 | -2.46 | -2.89 | 1.90 | -9.74 | 3.43 | 7.07 | 4.39 |
| 19 | 4.03 | 6.23 | -4.10 | -4.11 | 7.19 | -4.10 | -1.52 | 6.53 | -5.21 | -0.24 | 0.01 | 1.16 | 6.43 | -1.97 | -2.64 | -1.66 | -5.20 | -3.25 | -2.87 | -1.65 | 1.64 | -10.66 | 2.83 | 7.48 | 3.94 |
Export to Excel
0.20.0版中的新功能
实验性:这是一项新功能,仍在开发中. 我们将添加功能,并可能在将来的版本中进行重大更改. 我们希望听到您的反馈.
使用OpenPyXL或XlsxWriter引擎可以将样式化的DataFrames导出到Excel工作表中, OpenPyXL有一些支持. CSS2.2处理的属性包括:
-
background-color -
border-style,border-width,border-color及其{top,right,bottom,left变体} -
color -
font-family -
font-style -
font-weight -
text-align -
text-decoration -
vertical-align -
white-space: nowrap -
命名的颜色只有CSS2和形式的十六进制颜色
#rgb或#rrggbb,目前支持. -
以下伪CSS属性也可用于设置excel特定的样式属性:
-
number-format
-
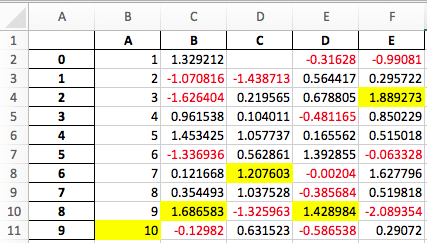
[40]:
df.style.
    applymap(color_negative_red).
    apply(highlight_max).
    to_excel('styled.xlsx', engine='openpyxl')
输出的屏幕截图:
Extensibility
大熊猫的核心是并将继续保持其"高性能,易于使用的数据结构". 考虑到这一点,我们希望DataFrame.style实现两个目标
-
提供令人愉悦的交互使用的API,并且"足够好"用于许多任务
-
为建立专用库提供基础
如果您在此基础上构建了一个很棒的库,请告诉我们,我们将链接到它.
Subclassing
如果默认模板不太适合您的需求,则可以继承Styler的子类并扩展或覆盖模板. 我们将展示一个扩展默认模板以在每个表之前插入自定义标头的示例.
[41]:
from jinja2 import Environment, ChoiceLoader, FileSystemLoader
from IPython.display import HTML
from pandas.io.formats.style import Styler
我们将使用以下模板:
[42]:
with open("templates/myhtml.tpl") as f:
    print(f.read())
{% extends "html.tpl" %}
{% block table %}
<h1>{{ table_title|default("My Table") }}</h1>
{{ super() }}
{% endblock table %}
现在我们已经创建了一个模板,我们需要建立一个了解它的Styler的子类.
[43]:
class MyStyler(Styler):
    env = Environment(
        loader=ChoiceLoader([
            FileSystemLoader("templates"),  # contains ours
            Styler.loader,  # the default
        ])
    )
    template = env.get_template("myhtml.tpl")
请注意,我们在环境的加载器中包括了原始加载器. 那是因为我们扩展了原始模板,因此Jinja环境需要能够找到它.
现在我们可以使用该自定义样式器. __init__需要一个DataFrame.
[44]:
MyStyler(df)
[44]:
My Table
| A | B | C | D | E | |
|---|---|---|---|---|---|
| 0 | 1.000000 | 1.329212 | nan | -0.316280 | -0.990810 |
| 1 | 2.000000 | -1.070816 | -1.438713 | 0.564417 | 0.295722 |
| 2 | 3.000000 | -1.626404 | 0.219565 | 0.678805 | 1.889273 |
| 3 | 4.000000 | 0.961538 | 0.104011 | nan | 0.850229 |
| 4 | 5.000000 | 1.453425 | 1.057737 | 0.165562 | 0.515018 |
| 5 | 6.000000 | -1.336936 | 0.562861 | 1.392855 | -0.063328 |
| 6 | 7.000000 | 0.121668 | 1.207603 | -0.002040 | 1.627796 |
| 7 | 8.000000 | 0.354493 | 1.037528 | -0.385684 | 0.519818 |
| 8 | 9.000000 | 1.686583 | -1.325963 | 1.428984 | -2.089354 |
| 9 | 10.000000 | -0.129820 | 0.631523 | -0.586538 | 0.290720 |
我们的自定义模板接受table_title关键字. 我们可以在.render方法中提供值.
[45]:
HTML(MyStyler(df).render(table_title="Extending Example"))
[45]:
Extending Example
| A | B | C | D | E | |
|---|---|---|---|---|---|
| 0 | 1.000000 | 1.329212 | nan | -0.316280 | -0.990810 |
| 1 | 2.000000 | -1.070816 | -1.438713 | 0.564417 | 0.295722 |
| 2 | 3.000000 | -1.626404 | 0.219565 | 0.678805 | 1.889273 |
| 3 | 4.000000 | 0.961538 | 0.104011 | nan | 0.850229 |
| 4 | 5.000000 | 1.453425 | 1.057737 | 0.165562 | 0.515018 |
| 5 | 6.000000 | -1.336936 | 0.562861 | 1.392855 | -0.063328 |
| 6 | 7.000000 | 0.121668 | 1.207603 | -0.002040 | 1.627796 |
| 7 | 8.000000 | 0.354493 | 1.037528 | -0.385684 | 0.519818 |
| 8 | 9.000000 | 1.686583 | -1.325963 | 1.428984 | -2.089354 |
| 9 | 10.000000 | -0.129820 | 0.631523 | -0.586538 | 0.290720 |
为了方便起见,我们提供了与自定义子类相同的Styler.from_custom_template方法.
[46]:
EasyStyler = Styler.from_custom_template("templates", "myhtml.tpl")
EasyStyler(df)
[46]:
My Table
| A | B | C | D | E | |
|---|---|---|---|---|---|
| 0 | 1.000000 | 1.329212 | nan | -0.316280 | -0.990810 |
| 1 | 2.000000 | -1.070816 | -1.438713 | 0.564417 | 0.295722 |
| 2 | 3.000000 | -1.626404 | 0.219565 | 0.678805 | 1.889273 |
| 3 | 4.000000 | 0.961538 | 0.104011 | nan | 0.850229 |
| 4 | 5.000000 | 1.453425 | 1.057737 | 0.165562 | 0.515018 |
| 5 | 6.000000 | -1.336936 | 0.562861 | 1.392855 | -0.063328 |
| 6 | 7.000000 | 0.121668 | 1.207603 | -0.002040 | 1.627796 |
| 7 | 8.000000 | 0.354493 | 1.037528 | -0.385684 | 0.519818 |
| 8 | 9.000000 | 1.686583 | -1.325963 | 1.428984 | -2.089354 |
| 9 | 10.000000 | -0.129820 | 0.631523 | -0.586538 | 0.290720 |
这是模板结构:
[47]:
with open("templates/template_structure.html") as f:
    structure = f.read()

HTML(structure)
[47]:
<style type="text/css">
</style>
<table ...>
</table>
有关更多详细信息,请参见GitHub存储库中的模板.