原创转载请注明出处:https://www.cnblogs.com/agilestyle/p/12692113.html
先看一个非线性的图例
准备数据
import matplotlib.pyplot as plt
import numpy as np
from sklearn.linear_model import LinearRegression

# 准备数据
n_dots = 500
X = np.linspace(-2 * np.pi, 2 * np.pi, n_dots)
y = np.sin(X) + 0.2 * np.random.rand(n_dots) - 0.1
plt.figure(figsize=(12, 8))
plt.scatter(X, y)

建模训练
# 建模训练
lr_model = LinearRegression()
X = X.reshape(-1, 1)
y = y.reshape(-1, 1)
lr_model.fit(X, y)
评估模型
# 评估模型
score = lr_model.score(X, y)
# 0.1483186188130836
score

plt.figure(figsize=(12, 8))
plt.scatter(X, y)
plt.plot(X, lr_model.predict(X), 'r')

可以看到,这个模型非常的欠拟合,解决办法:构建多项式特征(在原有特征的基础上进行变换得到的特征),使用多项式回归,设置当前degree为5
from sklearn.preprocessing import PolynomialFeatures
from sklearn.pipeline import Pipeline


def polynomial_model(degree=1):
    polynomial_features = PolynomialFeatures(degree=degree, include_bias=False, interaction_only=False)
    linear_regression = LinearRegression(normalize=True)
    pipeline = Pipeline([('polynomial_features', polynomial_features), ('linear_regression', linear_regression)])
    return pipeline


p_model = polynomial_model(5)
p_model.fit(X, y)
# 0.8975264192138223
p_model.score(X, y)

# array([-0.01237697])
print(p_model.named_steps['linear_regression'].intercept_)
# array([[6.36480157e-01, 5.50468654e-04, -7.14408527e-02, -2.36530821e-06, 1.46670352e-03]])
print(p_model.named_steps['linear_regression'].coef_)

plt.scatter(X, y)
plt.plot(X, p_model.predict(X), 'r')
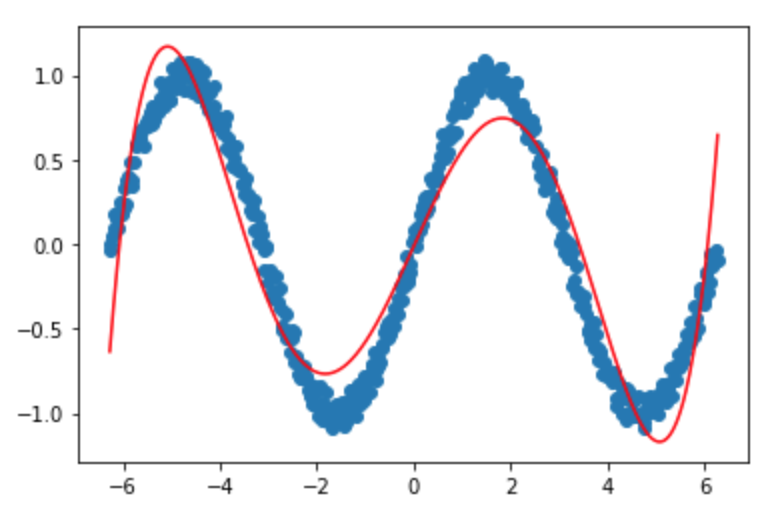
可以看到,当模型是5阶的时候,已经有了很好的改善。
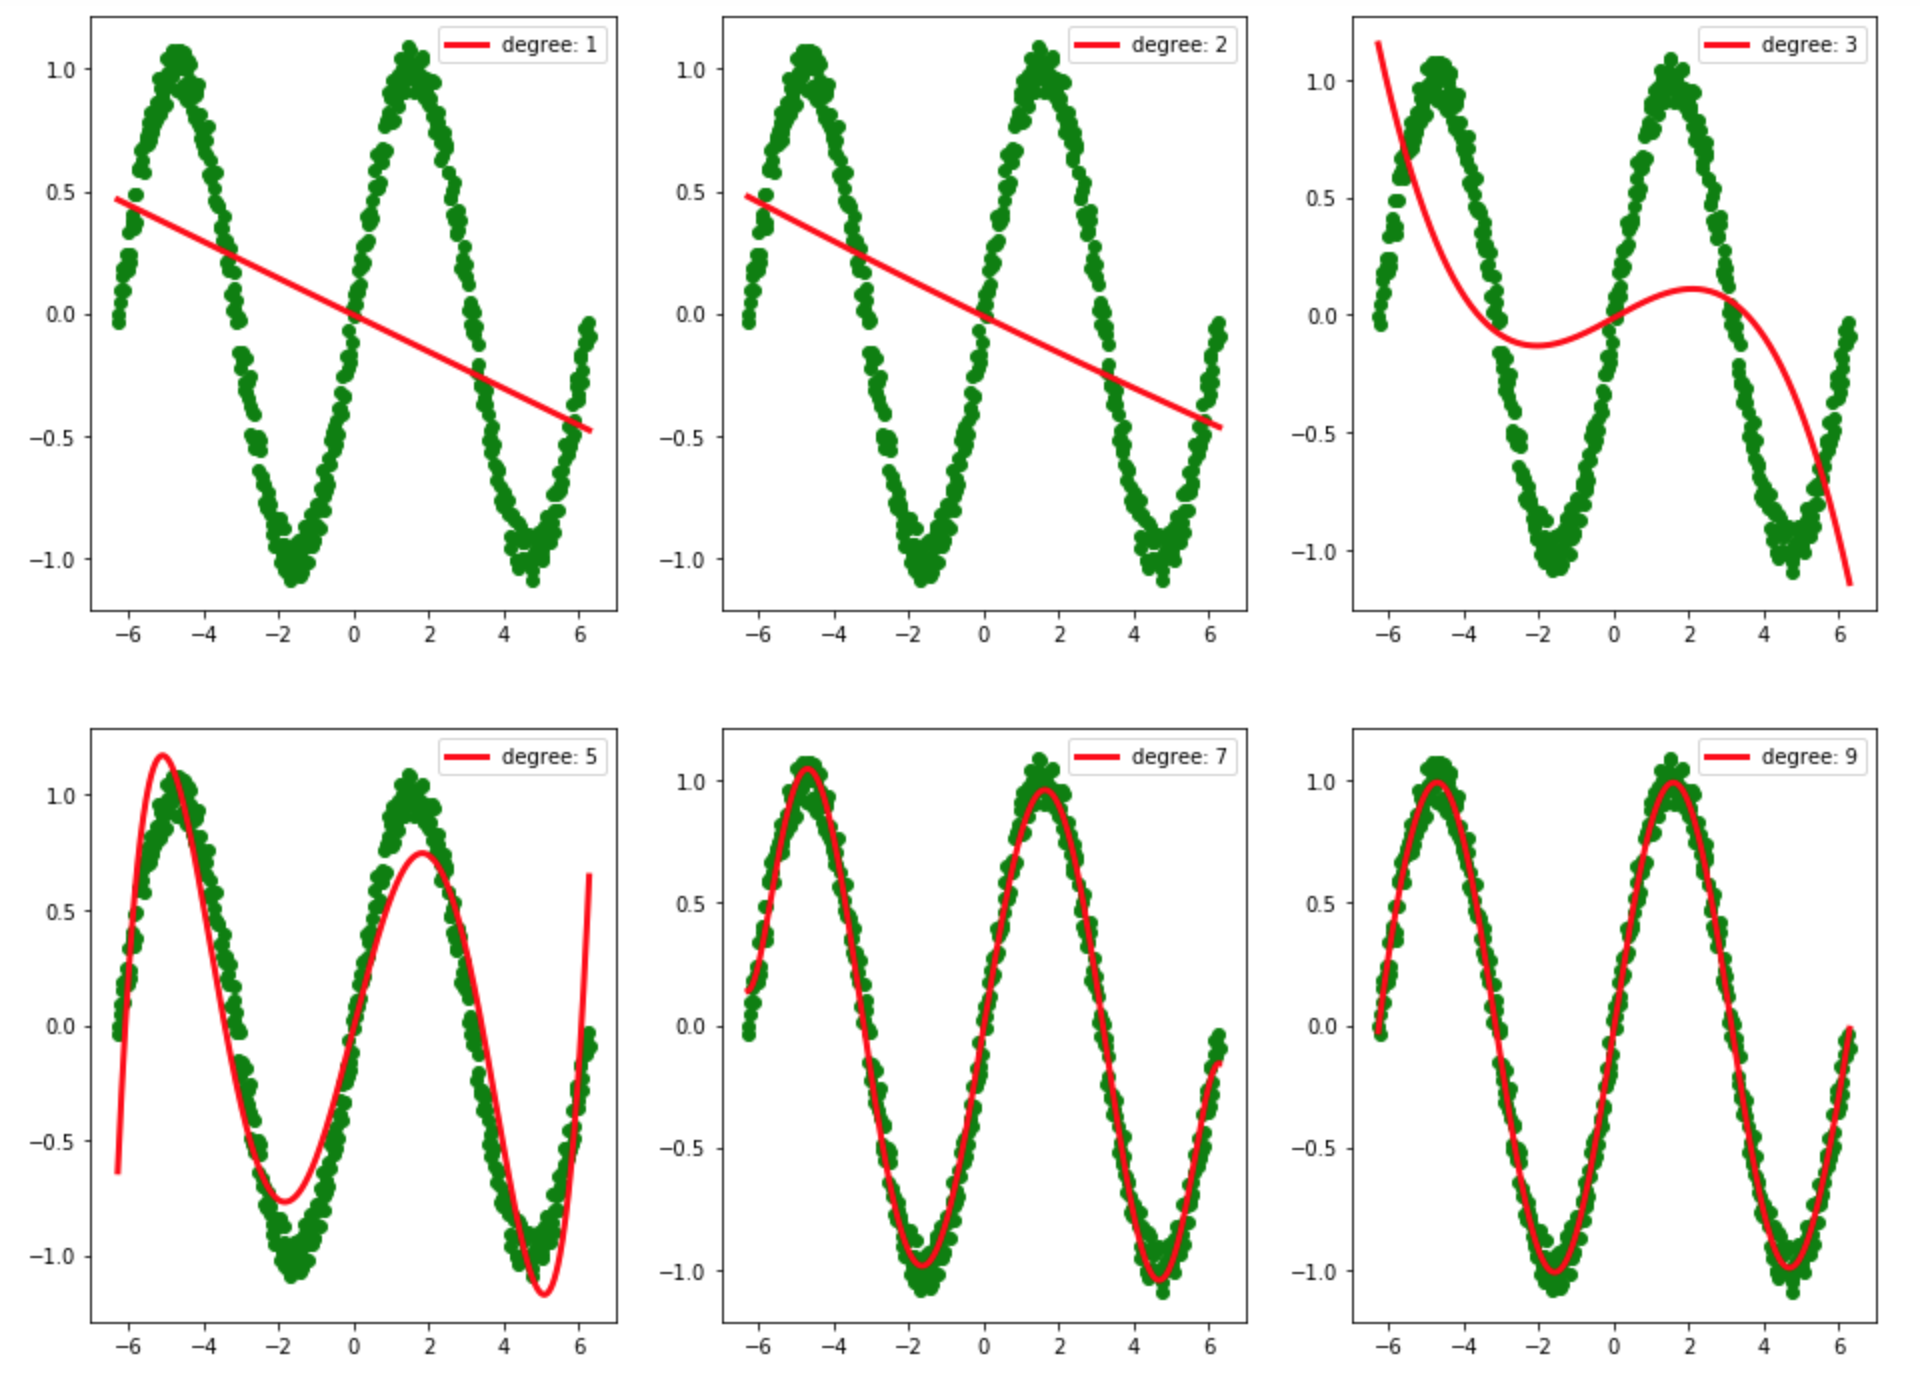
分别设置degree为 1,2,3,5,7,9
degrees = [1, 2, 3, 5, 7, 9]
results = []

for i in degrees:
    model = polynomial_model(i)
    model.fit(X, y)
    print(model.score(X, y))
    results.append({'model': model})

plt.figure(figsize=(16, 12))
for i, result in enumerate(results):
    # print(result['model'])
    degree = result['model'].named_steps['polynomial_features'].degree
    plt.subplot(2, 3, i + 1)
    plt.xlim(-7, 7)
    plt.scatter(X, y, c='g')
    plt.plot(X, result['model'].predict(X), 'r', linewidth=3, label='degree: %d' % degree)
    plt.legend()
Reference
https://scikit-learn.org/stable/modules/generated/sklearn.preprocessing.PolynomialFeatures.html
https://scikit-learn.org/stable/modules/generated/sklearn.pipeline.Pipeline.html