因业务需求,mysql主从常常出现同步故障,故研究了Prometheus来做mysql主从同步状态监控报警。
1 Prometheus介绍
1.1什么是Prometheus?
Prometheus是由SoundCloud开发的开源监控报警系统和时序列数据库(TSDB)。Prometheus使用Go语言开发,是Google BorgMon监控系统的开源版本。
2016年由Google发起Linux基金会旗下的原生云基金会(Cloud Native Computing Foundation), 将Prometheus纳入其下第二大开源项目。
Prometheus目前在开源社区相当活跃。
Prometheus和Heapster(Heapster是K8S的一个子项目,用于获取集群的性能数据。)相比功能更完善、更全面。Prometheus性能也足够支撑上万台规模的集群。
1.2 Prometheus的特点
一个多维数据模型,具有由指标名称和键/值对标识的时间序列数据
PromQL,一种 利用这种维度的灵活查询语言
不依赖分布式存储;单个服务器节点是自治的
时间序列收集通过 HTTP 上的拉模型发生
通过中间网关支持推送时间序列
通过服务发现或静态配置发现目标
多种图形和仪表板支持模式
1.3 Prometheus监控基本原理
Prometheus的基本原理是通过HTTP协议周期性抓取被监控组件的状态,任意组件只要提供对应的HTTP接口就可以接入监控。不需要任何SDK或者其他的集成过程。这样做非常适合做虚拟化环境监控系统,比如VM、Docker、Kubernetes等。输出被监控组件信息的HTTP接口被叫做exporter 。目前互联网公司常用的组件大部分都有exporter可以直接使用,比如Varnish、Haproxy、Nginx、MySQL、Linux系统信息(包括磁盘、内存、CPU、网络等等)。
1.4 Prometheus服务过程
Prometheus Daemon 负责定时去目标上抓取metrics(指标)数据,每个抓取目标需要暴露一个http服务的接口给它定时抓取。Prometheus支持通过配置文件、文本文件、Zookeeper、Consul、DNS SRV Lookup等方式指定抓取目标。Prometheus采用PULL的方式进行监控,即服务器可以直接通过目标PULL数据或者间接地通过中间网关来Push数据。
Prometheus在本地存储抓取的所有数据,并通过一定规则进行清理和整理数据,并把得到的结果存储到新的时间序列中。
Prometheus通过PromQL和其他API可视化地展示收集的数据。Prometheus支持很多方式的图表可视化,例如Grafana、自带的Promdash以及自身提供的模版引擎等等。Prometheus还提供HTTP API的查询方式,自定义所需要的输出。
PushGateway支持Client主动推送metrics到PushGateway,而Prometheus只是定时去Gateway上抓取数据。
Alertmanager是独立于Prometheus的一个组件,可以支持Prometheus的查询语句,提供十分灵活的报警方式。
下图说明了 Prometheus 的架构及其一些生态系统组件
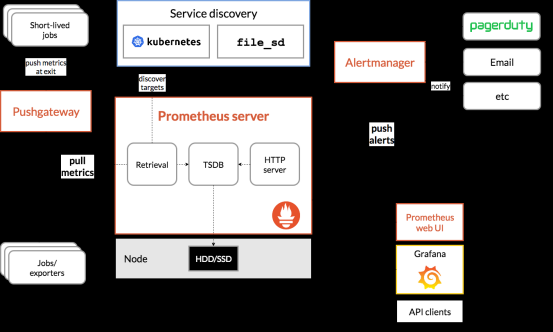
1.5 Prometheus 组件
Prometheus 生态圈中包含了多个组件,其中许多组件是可选的:
Prometheus Server: 用于收集和存储时间序列数据。
Client Library: 客户端库,为需要监控的服务生成相应的 metrics 并暴露给 Prometheus server。当 Prometheus server 来 pull 时,直接返回实时状态的 metrics。
Push Gateway: 主要用于短期的 jobs。由于这类 jobs 存在时间较短,可能在 Prometheus 来 pull 之前就消失了。为此,这次 jobs 可以直接向 Prometheus server 端推送它们的 metrics。这种方式主要用于服务层面的 metrics,对于机器层面的 metrices,需要使用 node exporter。
Exporters: 用于暴露已有的第三方服务的 metrics 给 Prometheus。
Alertmanager: 从 Prometheus server 端接收到 alerts 后,会进行去除重复数据,分组,并路由到对收的接受方式,发出报警。常见的接收方式有:电子邮件,pagerduty,OpsGenie, webhook 等。
一些其他的工具。
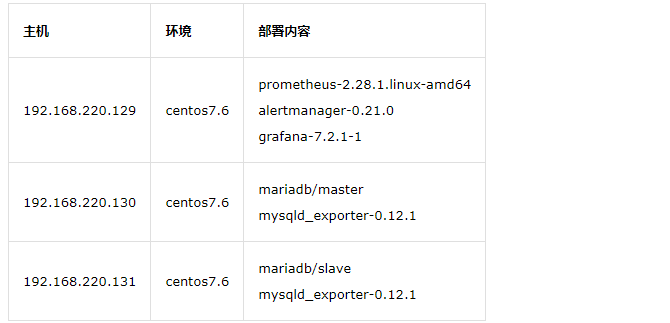
准备环境
2 安装 Prometheus Server
2.1 运行用户创建
groupadd prometheus
useradd -g prometheus -m -d /opt/prometheus/ -s /sbin/nologin prometheus
2.2 prometheus server安装
下载地址:https://github.com/prometheus/prometheus/releases/download/v2.28.1/prometheus-2.28.1.linux-amd64.tar.gz
tar -xzvf prometheus-2.28.1.linux-amd64.tar.gz -C /opt/
ln -s /opt/prometheus-2.28.1* /opt/prometheus
chown prometheus:prometheus -R prometheus*
cd /opt/prometheus
2.3 prometheus配置语法校验
建议每次修改prometheus配置之后, 都进行语法校验, 以免导致 prometheus server无法启动。
./promtool check config prometheus.yml
2.4 启动Prometheus
此时采用默认配置启动 prometheus server 看下界面, 稍后介绍如何监控Linux 服务器.
./prometheus --config.file=prometheus.yml
2.5 通过浏览器访问prometheus
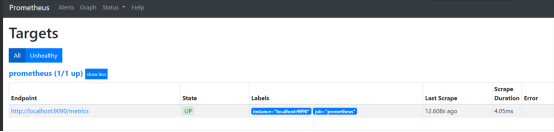
http:/localhost:9090/
发现 target 中只有 prometheus server, 因为我们还没有加入其他监控, 下面进行介绍,
2.6 设置prometheus系统服务,并配置开机启动
vim /usr/lib/systemd/system/prometheus.service
chown prometheus:prometheus /usr/lib/systemd/system/prometheus.service
vim /usr/lib/systemd/system/prometheus.service
[Unit]
Description=Prometheus
Documentation=https://prometheus.io/
After=network.target

[Service]
Type=simple
User=prometheus
# --storage.tsdb.path是可选项,默认数据目录在运行目录的./dada目录中
ExecStart=/opt/prometheus/prometheus --config.file=/opt/prometheus/prometheus.yml --web.enable-lifecycle --storage.tsdb.path=/opt/prometheus/data --storage.tsdb.retention=60d
Restart=on-failure

[Install]
WantedBy=multi-user.target
Prometheus启动参数说明
--config.file -- 指明prometheus的配置文件路径
--web.enable-lifecycle -- 指明prometheus配置更改后可以进行热加载
--storage.tsdb.path -- 指明监控数据存储路径
--storage.tsdb.retention --指明数据保留时间
设置开机启动
systemctl daemon-reload
systemctl enable prometheus.service
systemctl start prometheus.service
systemctl status prometheus.service

说明: prometheus在2.0之后默认的热加载配置没有开启, 配置修改后, 需要重启prometheus server才能生效, 这对于生产环境的监控是不可容忍的, 所以我们需要开启prometheus server的配置热加载功能。

在启动prometheus时加上参数 web.enable-lifecycle , 可以启用配置的热加载, 配置修改后, 热加载配置:
curl -X POST http://localhost:9090/-/reload
3 安装mysql_exporter
3.1 下载mysql_exporter并解压
下载地址:
https://github.com/prometheus/mysqld_exporter/releases/download/v0.12.1/mysqld_exporter-0.12.1.linux-amd64.tar.gz
tar -zxvf mysqld_exporter-0.12.1.linux-amd64.tar.gz -C /opt/
ln -s /opt/mysqld_exporter-0.12.1.linux-amd64 /opt/mysqld_exporter
3.2 需要授权用户给exporter使用
create user 'exporter'@'localhost' identified by '123456';
grant process,replication client,select on *.* to 'exporter'@'localhost';

在mysqld_exporter路径下创建my.cnf,添加刚才创建的exporter用户和密码
vim /opt/mysqld_exporter/my.cnf
[client]
user=exporter
password=123456
3.3 添加system系统服务
vim /usr/lib/systemd/system/mysqld_exporter.service
[Unit]
Description=mysqld_exporter
After=network.target

[Service]
User=root
Type=simple
ExecStart=/opt/mysqld_exporter/mysqld_exporter --config.my-cnf /opt/mysqld_exporter/my.cnf --collect.info_schema.processlist

Restart=on-failure

[Install]
WantedBy=multi-user.target
3.4 启动添加的system服务
systemctl daemon-reload
systemctl start mysqld_exporter.service
netstat -lntup | grep "9104"
3.5 修改prometheus.yml
vim /opt/prometheus/prometheus.yml
- job_name: 'mysql-mater-slave'
scrape_interval: 5s
static_configs:
- targets: ['192.168.220.130:9104','192.168.220.131:9104']
重启prometheus服务
systemctl restart prometheus.service
4 安装Grafana
4.1 下载并安装grafana
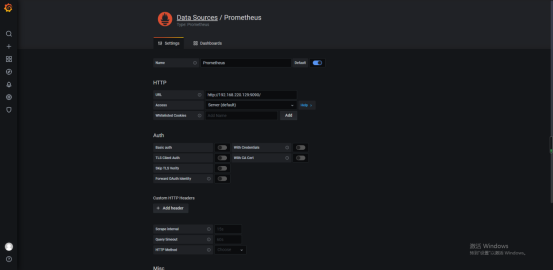
下载地址: https://grafana.com/grafana/download
wget https://dl.grafana.com/oss/release/grafana-7.2.1-1.x86_64.rpm
yum -y linstall grafana-7.2.1-1.x86_64.rpm
systemctl start grafana-server

granafa默认端口为3000,可以在浏览器中输入http://localhost:3000/
granafa首次登录账户名和密码admin/admin,可以修改
配置数据源Data sources->Add data source -> Prometheus,输入prometheus数据源的信息,主要是输入name和url
4.2导入模板
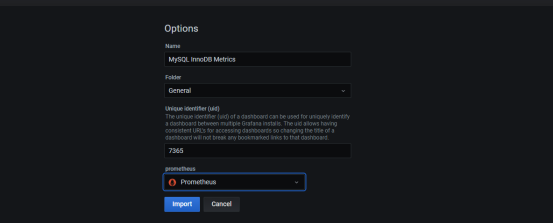
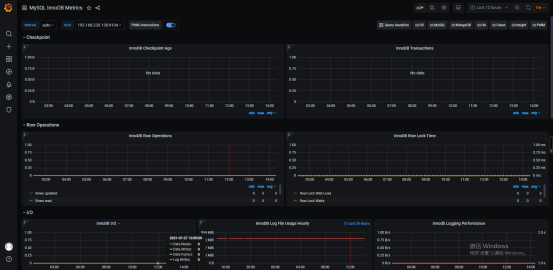
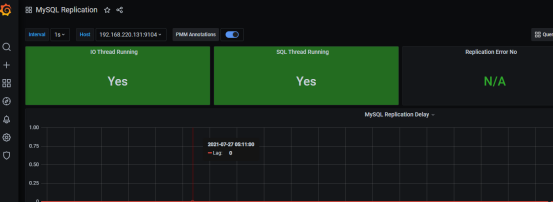
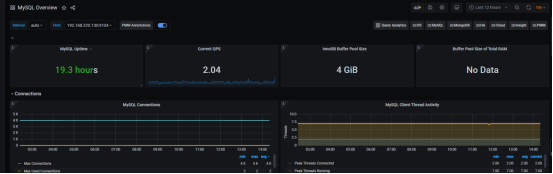
下载模板
https://grafana.com/grafana/dashboards/7371
https://grafana.com/grafana/dashboards/7362
https://grafana.com/grafana/dashboards/7365

在grafana中导入dashboard
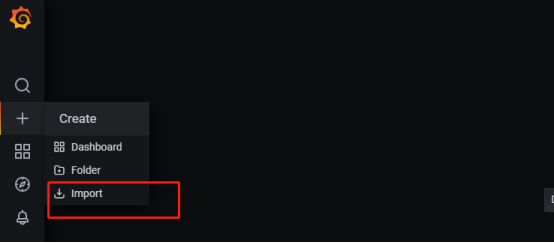
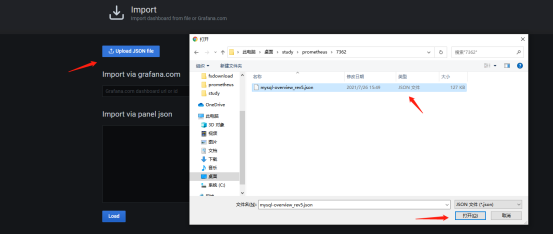
7371、7362两个模板导入如上通。
7371
5 安装alertmanager
5.1下载安装包并配置
下载地址:https://prometheus.io/download/
https://github.com/prometheus/alertmanager/releases/download/v0.21.0/alertmanager-0.21.0.linux-amd64.tar.gz
tar -xzvf alertmanager-0.21.0.linux-amd64.tar.gz -C /opt
ln -s /opt/alertmanager-0.21.0.linux-amd64 /opt/alertmanager
cd /opt/alertmanager && mv alertmanager.yml alertmanager.yml_bak
vim /opt/alertmanager/alertmanager.yml
global:
smtp_smarthost: smtp.exmail.xxx.com:465 # 发件人邮箱smtp地址
smtp_auth_username: xxxx@xxx.com # 发件人邮箱账号
smtp_from: xxx@xxx.com # 发件人邮箱账号
smtp_auth_password: xxxxxx # 发件人邮箱密码(邮箱授权码)
resolve_timeout: 5m
smtp_require_tls: false
route:
# group_by: ['alertname'] # 报警分组依据
group_wait: 10s # 最初即第一次等待多久时间发送一组警报的通知
group_interval: 10s # 在发送新警报前的等待时间
repeat_interval: 1m # 发送重复警报的周期 对于email配置中多频繁
receiver: 'email'
receivers:
- name: email
email_configs:
- send_resolved: true
to: xxx@xxx.com, xxx@xxx.com # 收件人邮箱账号
检验配置文件
[root@prometheus /opt/alertmanager]# ./amtool check-config conf/alertmanager.yml
5.2设置alertmanager系统服务,并配置开机启动
vim /usr/lib/systemd/system/alertmanager.service
[Unit]
Description=Prometheus
Documentation=https://prometheus.io/
After=network.target
[Service]
Type=simple
User=prometheus
ExecStart=/opt/alertmanager/alertmanager --config.file=/opt/alertmanager/alertmanager.yml --storage.path=/opt/alertmanager/data
Restart=on-failure
[Install]
WantedBy=multi-user.target

设置开机启动
systemctl daemon-reload
systemctl enable alertmanager.service
systemctl start alertmanager.service
systemctl status alertmanager.service
5.3 prometheus配置
在prometheus目录下编辑报警模版mysql_rules.yml,添加一些自定义报警项。
vim /opt/prometheus/rules/mysql_rules.yml
groups:
- name: MySQL-rules
  rules:
  - alert: MySQL Status
    expr: up == 0
    for: 5s
    labels:
      severity: warning
    annotations:
      summary: "{{$labels.instance}}: MySQL has stop !!!"
      description: "检测MySQL数据库运行状态"

  - alert: MySQL Slave IO Thread Status
    expr: mysql_slave_status_slave_io_running == 0
    for: 5s
    labels:
      severity: warning
    annotations:
      summary: "{{$labels.instance}}: MySQL Slave IO Thread has stop !!!"
      description: "检测MySQL主从IO线程运行状态"

  - alert: MySQL Slave SQL Thread Status
    expr: mysql_slave_status_slave_sql_running == 0
    for: 5s
    labels:
      severity: warning
    annotations:
      summary: "{{$labels.instance}}: MySQL Slave SQL Thread has stop !!!"
      description: "检测MySQL主从SQL线程运行状态"

  - alert: MySQL Slave Delay Status
    expr: mysql_slave_status_sql_delay == 30
    for: 5s
    labels:
      severity: warning
    annotations:
      summary: "{{$labels.instance}}: MySQL Slave Delay has more than 30s !!!"
      description: "检测MySQL主从延时状态"


  - alert: Mysql_Too_Many_Connections
    expr: rate(mysql_global_status_threads_connected[5m]) > 200
    for: 2m
    labels:
      severity: warning
    annotations:
      summary: "{{$labels.instance}}: 连接数过多"
      description: "{{$labels.instance}}: 连接数过多,请处理 ,(current value is: {{ $value }})"

  - alert: Mysql_Too_Many_slow_queries
    expr: rate(mysql_global_status_slow_queries[5m]) > 3
    for: 2m
    labels:
      severity: warning
    annotations:
      summary: "{{$labels.instance}}: 慢查询有点多,请检查处理"
      description: "{{$labels.instance}}: Mysql slow_queries is more than 3 per second ,(current value is: {{ $value }})"
在prometheus目录下编辑prometheus的配置文件,将监控的配置信息添加到prometheus.yml。如下图所示

检查配置
./promtool check config prometheus.yml
重启Prometheus加载配置
systemctl restart prometheus.service
5.4 安装sendmail服务
yum -y install sendmail
5.5 修改granfana.ini配置文件
vim /etc/grafana/grafana.ini
#################################### SMTP / Emailing ##########################
[smtp]
;enabled = false
;host = localhost:25
;user =
# If the password contains # or ; you have to wrap it with triple quotes. Ex """#password;"""
;password =
;cert_file =
;key_file =
;skip_verify = false
;from_address = admin@grafana.localhost
;from_name = Grafana
# EHLO identity in SMTP dialog (defaults to instance_name)
;ehlo_identity = dashboard.example.com

enabled = true
host = smtp.exmail.qq.com:465
user = 发件邮箱地址
password = GIliu.123
skip_verify = true
from_address = 发件邮箱地址
from_name = Grafana

重启grafana加载配置
systemctl restart grafana-server
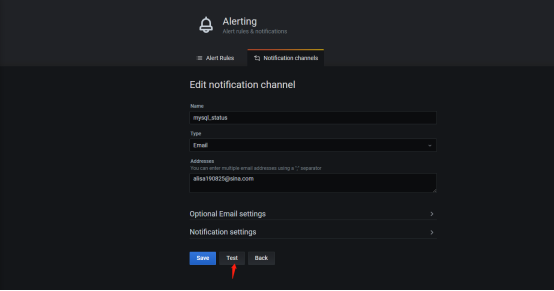
5.6在grafana上测试邮件发送
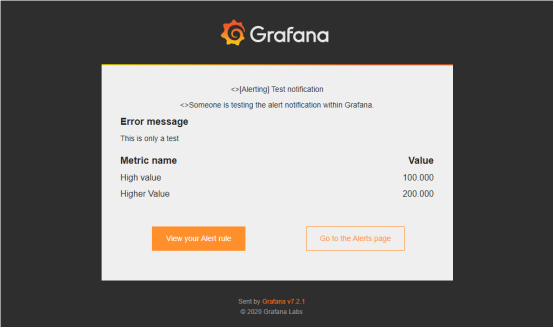
邮箱查验
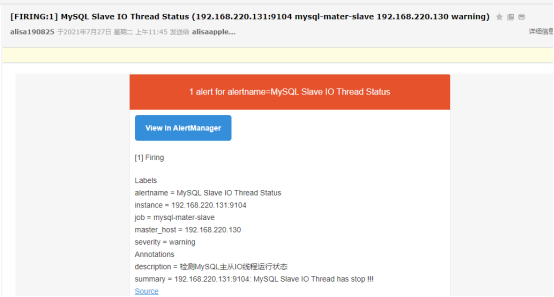
5.7验证邮件报警
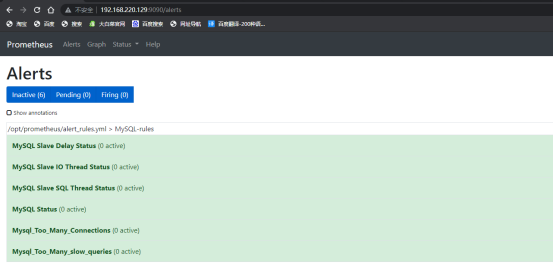
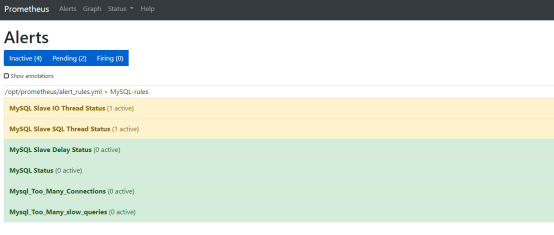
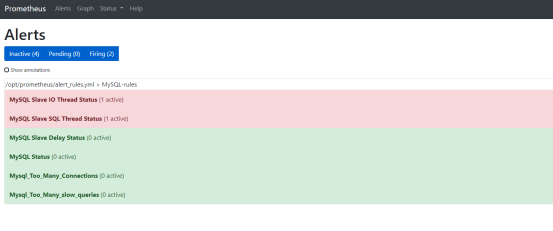
登陆prometheus的web页面,查看报警信息。
浏览器输入Prometheus_IP:9090 ,可以看到各个报警项的状态。
停掉主从线程,模拟触发报警
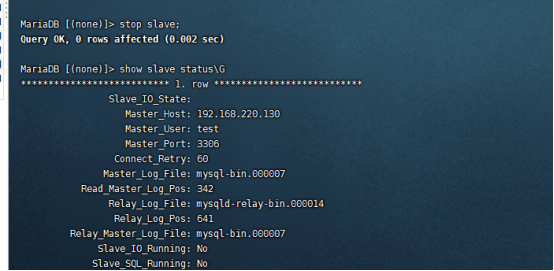
Slave SQL线程停掉后,报警项颜色变成黄色,持续时间超过定义的持续时间后,颜色变红,并发送邮件。
收到报警邮件