一、matplotlib.pyplot.scatter用来画散点图
import matplotlib.pyplot as plt
import matplotlib as mpl
mpl.rcParams['font.sans-serif'] = ['SimHei']#设置中文字体,否则中文title会乱码
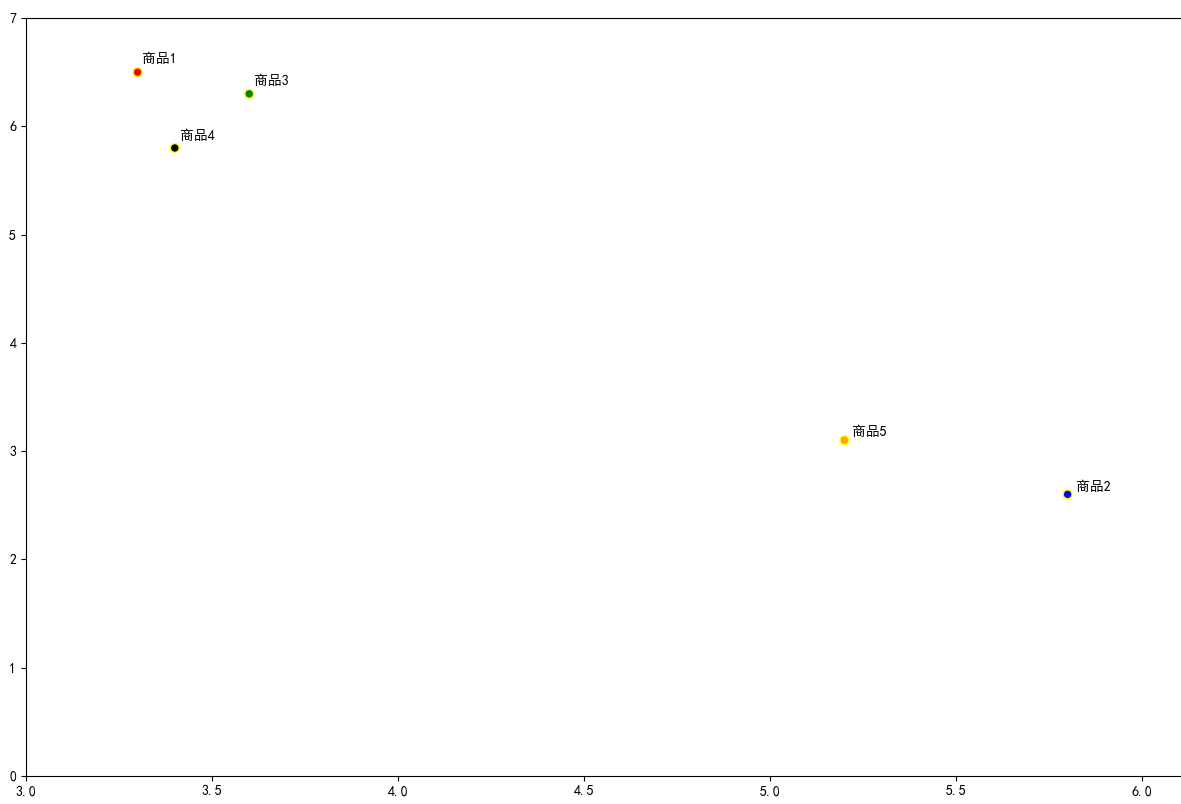
x = [3.3, 5.8, 3.6, 3.4, 5.2]
y = [6.5, 2.6, 6.3, 5.8, 3.1]
c = ['red', 'blue', 'green', 'black', 'orange']
plt.scatter(x, y, c=c, edgecolor='yellow', s=80)#散点图,可以设置每个点的颜色不同
plt.axis([0,7, 0, 7])#可以设置坐标轴的起点终点位置,x轴从0到7,y轴从0到7
#为点做标注
#annotate语法说明 :annotate(s='str' ,xy=(x,y) , ...)
for index,ab in enumerate(zip(x,y)):
plt.annotate("商品%d" %(index+1), xy=ab, textcoords='offset points')
# 自动保存图表,参数2是剪裁掉多余空白区
plt.savefig('squares_plot.png',bbox_inches='tight')