吴恩达 MachineLearning Week8
知识点概述
1. K - means 算法
K - means 算法用于解决聚类问题,属于无监督学习。可以对没有标记的数据进行处理,将其分成 K 类。其步骤如下:
- 从数据集随机选择 K 个作为起始的均值点
- 计算每个点到各个均值点的距离,并将点归类到距离最近的点类中。(假设 x 点到 m ( m <= K) 号点距离最短,则 x 归为第 m 类)
- 计算各个类的平均值( 即把被分到各个类的 x 相加除以类中 x 的个数)将新的坐标作为新的均值点
- 从 2 开始重复直到收敛
- 从 1 开始重复 ,最后取收敛点到各类点之合最小的一组
2. PLA( Principal Component Analysis )
用于将数据降维,加快模型的处理和计算速度。其步骤如下:
1. 计算参数sigma:
![]()
其中 X 是输入数据的矩阵。
2. 将参数带入公式:
![]()
得到的 U 为一个 N * N 的矩阵 , S 是一个对角矩阵(除了主对角线以外数据全都是0)
假设我们要降到 K 维,则取矩阵 U 的前 K 列,得到U_reduce(n * k) 将 X 和 U_reduce 相乘得到新的矩阵 Z ,就是降后的矩阵,用来代替X
3. 将 Z 和 U_reduce 的转置相乘,可以得到还原矩阵 X_approx,我们有如下公式
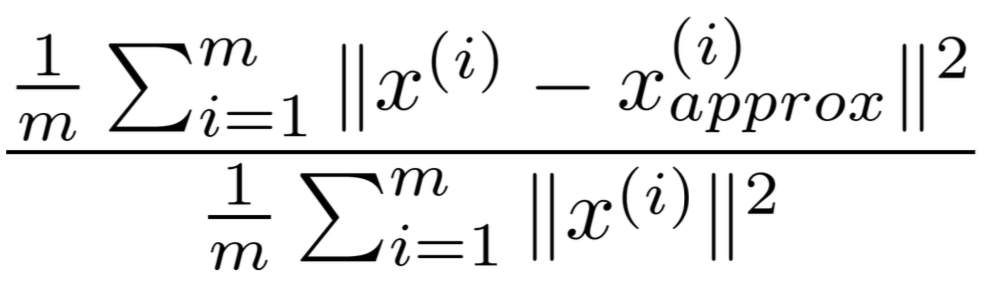
这个值越小,说明降维对原数据造成的影响越小,这个值一般要在 0.01 ~ 0.1之间。而利用 S 矩阵可以很方便的计算这个值。公式:
1 - ![]()
k 即要取的 K 维。我们要找一个 k 值,使得该值小于一定值。
课后练习题代码
pca.m
function [U, S] = pca(X)
%PCA Run principal component analysis on the dataset X
%   [U, S, X] = pca(X) computes eigenvectors of the covariance matrix of X
%   Returns the eigenvectors U, the eigenvalues (on diagonal) in S
%

% Useful values
[m, n] = size(X);

% You need to return the following variables correctly.
U = zeros(n);
S = zeros(n);

% ====================== YOUR CODE HERE ======================
% Instructions: You should first compute the covariance matrix. Then, you
%               should use the "svd" function to compute the eigenvectors
%               and eigenvalues of the covariance matrix.
%

Sigma = (X' * X) / m ;
[U , S , V] = svd(Sigma);


% =========================================================================

end
projectData.m
function Z = projectData(X, U, K)
%PROJECTDATA Computes the reduced data representation when projecting only
%on to the top k eigenvectors
%   Z = projectData(X, U, K) computes the projection of
%   the normalized inputs X into the reduced dimensional space spanned by
%   the first K columns of U. It returns the projected examples in Z.
%

% You need to return the following variables correctly.
Z = zeros(size(X, 1), K);

% ====================== YOUR CODE HERE ======================
% Instructions: Compute the projection of the data using only the top K
%               eigenvectors in U (first K columns).
%               For the i-th example X(i,:), the projection on to the k-th
%               eigenvector is given as follows:
%                    x = X(i, :)';
%                    projection_k = x' * U(:, k);
%

Z = X * U(: , 1:K);


% =============================================================

end
recoverData.m
function X_rec = recoverData(Z, U, K)
%RECOVERDATA Recovers an approximation of the original data when using the
%projected data
%   X_rec = RECOVERDATA(Z, U, K) recovers an approximation the
%   original data that has been reduced to K dimensions. It returns the
%   approximate reconstruction in X_rec.
%

% You need to return the following variables correctly.
X_rec = zeros(size(Z, 1), size(U, 1));

% ====================== YOUR CODE HERE ======================
% Instructions: Compute the approximation of the data by projecting back
%               onto the original space using the top K eigenvectors in U.
%
%               For the i-th example Z(i,:), the (approximate)
%               recovered data for dimension j is given as follows:
%                    v = Z(i, :)';
%                    recovered_j = v' * U(j, 1:K)';
%
%               Notice that U(j, 1:K) is a row vector.
%

X_rec = Z * U(: , 1:K)';

% =============================================================

end
findClosestCentroids.m
function idx = findClosestCentroids(X, centroids)
%FINDCLOSESTCENTROIDS computes the centroid memberships for every example
%   idx = FINDCLOSESTCENTROIDS (X, centroids) returns the closest centroids
%   in idx for a dataset X where each row is a single example. idx = m x 1
%   vector of centroid assignments (i.e. each entry in range [1..K])
%

% Set K
K = size(centroids, 1);

% You need to return the following variables correctly.
idx = zeros(size(X,1), 1);

% ====================== YOUR CODE HERE ======================
% Instructions: Go over every example, find its closest centroid, and store
%               the index inside idx at the appropriate location.
%               Concretely, idx(i) should contain the index of the centroid
%               closest to example i. Hence, it should be a value in the
%               range 1..K
%
% Note: You can use a for-loop over the examples to compute this.
%
m = size(X , 1);

for i = 1 : m
    x = X(i , :);
    min = sum((x - centroids(1 , :)) .^ 2);
    idx(i) = 1;
    for j = 2 : K
        sumnum = sum((x - centroids(j , :)) .^ 2);
        if sumnum < min
            min = sumnum;
            idx(i) = j;
        end
    end
end

% =============================================================

end
computeCentroids.m
function centroids = computeCentroids(X, idx, K)
%COMPUTECENTROIDS returns the new centroids by computing the means of the
%data points assigned to each centroid.
%   centroids = COMPUTECENTROIDS(X, idx, K) returns the new centroids by
%   computing the means of the data points assigned to each centroid. It is
%   given a dataset X where each row is a single data point, a vector
%   idx of centroid assignments (i.e. each entry in range [1..K]) for each
%   example, and K, the number of centroids. You should return a matrix
%   centroids, where each row of centroids is the mean of the data points
%   assigned to it.
%

% Useful variables
[m n] = size(X);

% You need to return the following variables correctly.
centroids = zeros(K, n);


% ====================== YOUR CODE HERE ======================
% Instructions: Go over every centroid and compute mean of all points that
%               belong to it. Concretely, the row vector centroids(i, :)
%               should contain the mean of the data points assigned to
%               centroid i.
%
% Note: You can use a for-loop over the centroids to compute this.
%

cnt = zeros(K , n);
for i = 1 : m
    centroids(idx(i) , :) = centroids(idx(i) , :) + X(i , :)
    cnt(idx(i) , :) = cnt(idx(i) , :) + 1;
end

centroids = centroids ./ cnt;

% =============================================================


end